Align and count
The Align and count analysis step analyzes the data, producing expression levels (count data) for the samples.
There is an analysis credit cost to this step, which is why you need to have the required amount of analysis credits in your account to start analysis. The analysis credit cost equals the number of samples that will be created from this step. For most sample kits, this is the same as the number of input sample data sets. For a kit like the QIAseq UPX 3' Transcriptome Kit, it equals the number of wells selected. Your analysis credit balance is visible from the top right of the Analysis Portal page. The analysis credit cost will be calculated once you have made your selections from the Align and count dialog drop-downs as described below. If you do not have sufficient analysis credits, you may follow the link to purchase more.
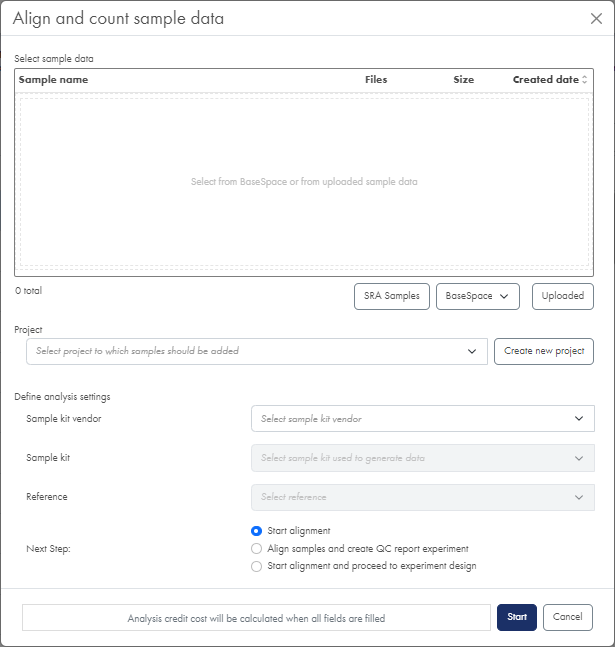
Figure 6: The Align and count dialog.
- Click the Align sample data button at the top of the Analysis Portal page. This opens the Align and count dialog (figure 6).
- Select the data to analyze. This can be data from the Sequence Read Archive (SRA), BaseSpace or data uploaded to the RNA-seq Analysis Portal earlier:
- Selecting SRA data
- Click on the SRA samples button to open the Sequence Read Archive - data retrieval dialog (figure 7).
- In the SRA accession IDs field, enter the identifiers separated by comma, semi-colon, tab or line break if needed.
To search SRA for relevant identifiers, click on the Sequence Read Archive's advanced search link to open SRA in a new tab. Look for identifiers beginning with SRR, SRX, SRS, or SRP to point to one or more samples. - Click on Search to populate project summary info, a link to associated metadata, and a list of samples for each identifier.
- Click on the Metadata link next to each project to download the metadata needed later for setting up experiments. This opens the relevant page in SRA.
- Select the samples to analyze and click on Add.
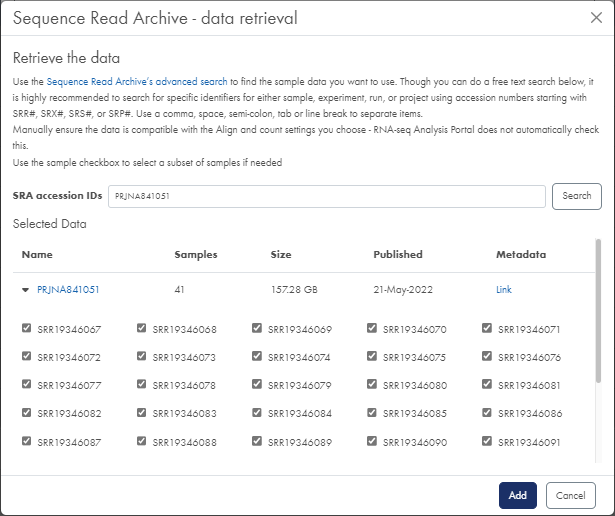
Figure 7: The Sequence Read Archive data retrieval dialog allows you to search and select data from SRA. - Selecting BaseSpace data
- Click on the BaseSpace dropdown and select the region where you data is stored. This redirects you to Illumina's Sign In page (figure 8).
- Enter your BaseSpace credentials and click on Sign In. This takes you back to RNA-seq Analysis Portal.
- In the Select sample data from BaseSpace dialog, select the relevant project and click on Open.
- Select the data to use and click on Select.
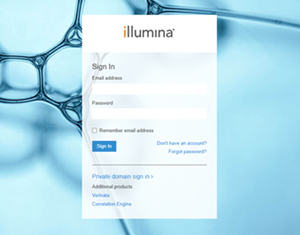
Figure 8: The Illumina Sign In page - Selecting previously uploaded data
- Click on the Uploaded button.
- In the Select from uploaded sample data dialog, select the data to use. Use the filter and sort options to limit the list of samples to select from.
- Click on Select
- Selecting SRA data
- Edit sample names. Optionally use this to rename your samples if you prefer names different from those automatically assigned from the FASTQ file names. Note that once samples are generated, their names can no longer be changed.
- Click Edit sample names
- Enter new sample names manually (figure 9), or click Import from file to upload a .csv, .txt, or .xlsx file. The file must list the original sample name in column 1, and the new name in column 2. No header is required.
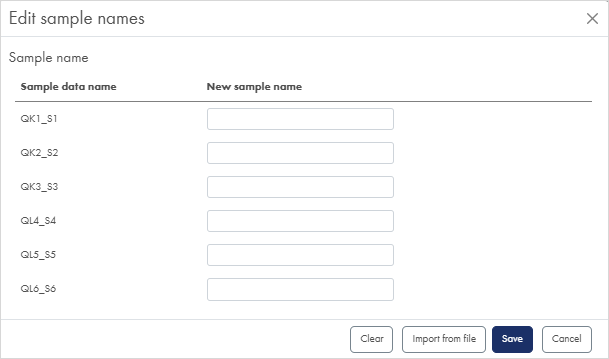
Figure 9: Use the 'Edit sample names' functionality to change the name of your samples. - Define the project that your samples should be added to. Select an existing project from the drop-down list, or create a new project by clicking on Create new project.
The choice of project will determine the analysis workflow version with which your samples will be processed, see the section About analysis workflow versions and sample comparability. - From the Sample kit vendor drop-down list, select the vendor of your sample kit.
- From the Sample kit drop-down list, select the sample kit relevant for your data.
For the QIAseq UPXome RNA Lib Kit or QIAseq FastSelect RNA Lib Kit, select the dropdown item that corresponds to the applied cDNA synthesis protocol: N6-T RT primer, ODT-T RT primer, or combined N6-T RT and ODT-T RT primers.
- From the Sequencing platform drop-down list, select the sequencing platform that was used for sequencing the data.
- If you used spike-ins, check the Spike-ins box.
- From the Reference drop-down list, select the relevant reference data option (figure 10).
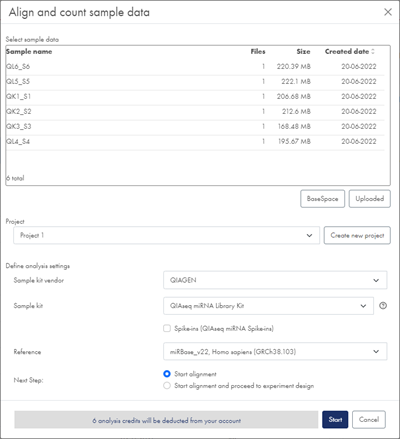
Figure 10: In the Align and count dialog, select sample data, project, vendor, sample kit, sequencing platform and reference.
If you selected the QIAseq UPX 3' Transcriptiome Kit, you must specify if you used the custom R2 primer:
- Custom R2 primer (QIAseq D Read 2 Primer I): Check the box if you used the Custom R2 primer.
See Align and count dialog for additional guidance.
Both the QIAseq UPX 3' Transcriptiome Kit and QIAseq UPXome RNA Lib Kit rely on demultiplexed sample data for the analysis. A well-selection option is presented in the demultiplexing step if you select only one input sample. You can specify number and location of samples to be demultiplexed from the input file. "Use already demultiplexed sample data" option will be automatically enabled if multiple input are selected, as we assume that the data has been demultiplexed elsewhere.
- Well selection: Click on Open well-picker and select the wells used when generating your data (figure 11). Then click on OK.
See Align and count dialog for additional guidance.
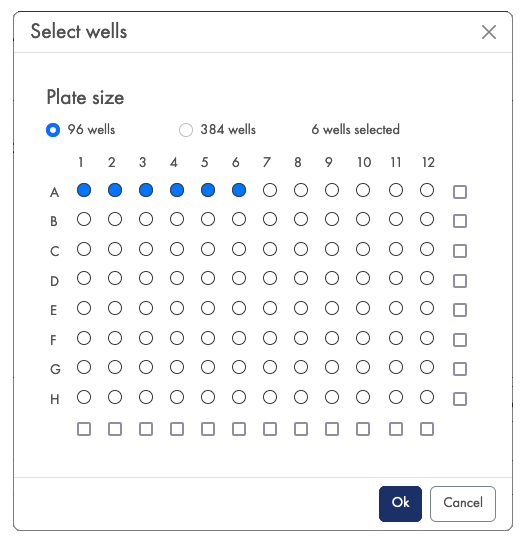
Figure 11: Well selection is required for the QIAseq UPX 3' Transcriptiome Kit and QIAseq UPXome RNA Lib kits.
Once all mandatory selections have been made, the analysis credit cost will be displayed at the bottom of the dialog (figure 12). If you have insufficient analysis credits in your account, you will need to purchase more before you will be able to proceed.

Figure 12: The analysis credit cost will be displayed at the bottom of the Align and count dialog once all mandatory selections have been made.
- Under Next Step, select how to proceed:
- Start alignment. Align and count analysis will start and the dialog will close. When you later wish to set up an experiment with your samples, follow the instructions under Create experiment from the beginning.
- Align samples and create QC report experiment. Align and count analysis will start and a QC Experiment containing only an Experiment summary and QC report is created in the selected project.
- Start alignment and proceed to experiment design. Align and count analysis will start and you will be taken to page 2 of the Create experiment dialog with your newly created samples pre-selected. With this, you skip a number of steps and can follow the Create experiment instructions from bullet 6.
- Click on Start to submit the data for analysis.
Depending on your preferences, you will receive an email notification when your samples are done, see Email notification setup in the User Interface chapter.