User Interface
The RNA-seq Analysis Portal interface has two main pages, Analysis Portal, and Samples. You navigate between these via the navigation bar at the top. The pages are described in detail in later sections.

Figure 22: The RNA-seq Analysis Portal user interface includes a top navigation bar.
The Help menu on the right side of the navigation bar (figure 22) provides links to product resources like the user manual. It also includes:
- Share experiment with Support. Available in Project view or Differential expression view. Share the active experiment with QIAGEN Technical Support for investigation or troubleshooting. To link it to an existing support case, enter the case number from the Support email subject line. The experiment is copied to a dedicated Support account.
- Email notification setup. Adjust your preferences for receiving RNA-seq Analysis Portal email notifications, such as when analyses finish or when a project copy is shared with you (figure 23).
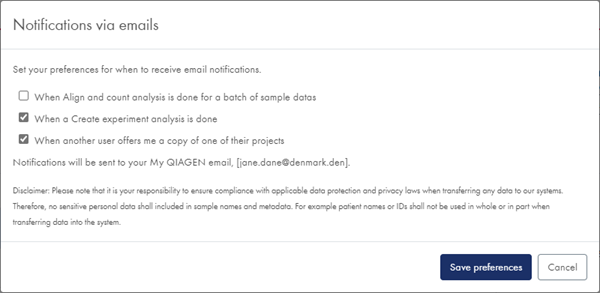
Figure 23: Via the Email notification setup you can opt out of receiving emails when samples or experiments are done, and when colleagues send copies of projects to you. - Display introduction tips. Choose whether to show guide dialogs with tips on using RNA-seq Analysis Portal.
- Contact Support. Reach the Support team for assistance or to provide feedback.
- Pending project copies. View copies of projects you have shared or that others have shared with you (see Send copy of project).
To log out of RNA-seq Analysis Portal and your My QIAGEN account, click on the ![]() icon in the footer.
icon in the footer.
Click on the ![]() icon (figure 24) in the footer to find links to the end user and data processing agreements and third party software notices.
icon (figure 24) in the footer to find links to the end user and data processing agreements and third party software notices.
![]()
Figure 24: Log out by clicking on the icon at the far right of the RNA-seq Analysis Portal footer.
RNA-seq Analysis Portal terminology and data organization
Terminology
The following terminology is used for different types of data and output:
- Sample data. Raw sequencing files grouped based on file naming. Input to the Align and count analysis step.
- Samples. Expression level samples, i.e. count data. Output from the Align and count analysis step.
- Differential expression. A comparison of expression level differences between two or more groups of samples. The Create experiment analysis step generates one or more differential expressions.
- Experiment summary and QC report. An overview of the samples within a particular experiment, the metadata assigned to them, and selected analysis quality control metrics.
- Comparison. A comparison of two or three differential expression analysis results. Output from Compare analyses.
- Analysis credits. The cost of one Align and count analysis is one analysis credit. Note that for the QIAseq UPX 3' Transcriptome Kit, the number of Align and count analyses and hence the total credit cost will depend on the number of wells selected. If a sample is deleted while the Align and count analysis is still in progress, or if the analysis should fail, the analysis credit is returned to your account.
Data organization
Data is organized into projects and experiments:
- Every sample belongs to a project, specified in the Align and count dialog.
- A project is a collection of samples and experiments.
- An experiment belongs to a project, specified in the Create experiment dialog. It is created from samples within the specific project, often just a subset. An experiment will contain one Experiment summary and QC report and one or more differential expression analysis results, all based on the same metadata attribute(s). It can also contain one or more comparisons.
Subsections