Comparison view
The Comparison view presents a table and a Venn diagram (figure 59). These two elements display the same set of features and are linked. You can adjust the FDR p-value and fold change thresholds using the controls on the right to include more or fewer features in the comparison.
Venn diagram
The Venn diagram illustrates the overlap of differentially expressed features across multiple differential expression analyses. Each section of the diagram shows the number of unique or shared features. Click any section of the diagram to select it; the corresponding features will then be automatically highlighted in the table.
Download Venn diagram. To download the Venn diagram, hover over the diagram and click on Venn diagram.
Table
The table lists all features included in the comparison, along with their FDR p-values and fold change values from each differential expression analysis.
Download features. To download the table content, click on Feature list above the table and select:
- Full feature list. Download the full table in .xlsx format.
- Selected features. Download only the selected features in .xlsx format.
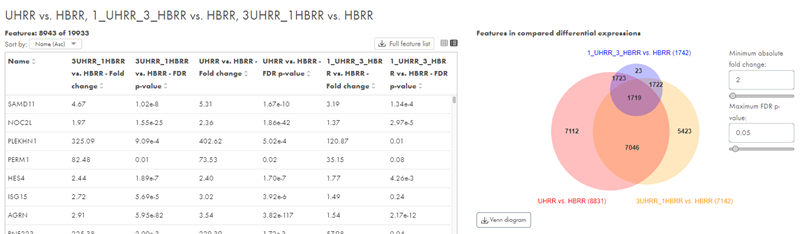
Figure 59: The Venn diagram shows the overlap of differentially expressed genes or miRNAs in different differential expression analyses.