Combine Reports output
Combine Reports generates a single report (![]() ) containing summary items and other selected information from the reports provided as input.
) containing summary items and other selected information from the reports provided as input.
The report contains one section per input report type, as described in Report types and combined report content. Summary items are displayed in table format.
Note: The summaries for reports produced by Trim Sequences do not follow the format described below.
The tables contain one row per input report and one column per summary item. The last rows, shaded in pale gray, report the minimum, median, maximum, mean and standard deviation for all numeric summary items (figure 28.22).
The first column indicates the sample name, i.e. the name of the input report. The combined report contains links to the input reports and clicking on the sample name selects the corresponding report in the Navigation Area.
Highlighted cells
Table cells are highlighted in yellow if they are detected as outliers (figure 28.22). For each numeric summary item, the lower quartile - 1.5 IQR (interquartile range) to upper quartile + 1.5 IQR range is calculated using all the values for the summary item. Samples with values outside this range are considered outliers.
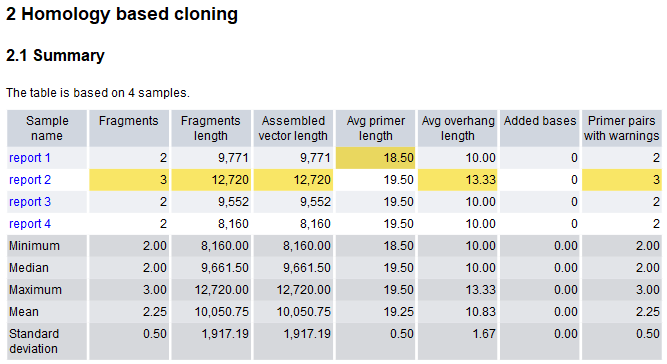
Figure 28.22: Summary items are reported in tables. Cells are highlighted in yellow when identified as outliers.
Summary section
By default, combined reports contain a summary section, offering a quick overview of samples that have been identified as outliers and/or problematic. The summary section is only present if it was included when configuring the report content (see Specifying the content of the report) and it only contains summaries those sections/subsections/summary items that are also included in the combined report.