Count-based and extra-chromosomal filters
Barcodes of low-quality can arise from different sources, such as cells that are damaged or failure in the library preparation. These can normally be detected based on the following metrics:
- Number of reads. Barcodes with few number of reads result from loosing RNA during library preparation.
- Number of expressed features. Barcodes with few number of expressed features indicate that the diverse transcript population has not been successfully captured.
- Proportion of reads mapped to mitochondria. Barcodes with proportionally many reads mapped to the mitochondria are indicative of low quality cells, presumably due to loss of cytoplasmic RNA from perforated cells [Islam et al., 2014,Ilicic et al., 2016].
- Proportion of reads mapped to spike-in control regions. When spike-in controls are used, barcodes with proportionally many reads mapped to the spike-in controls are symptomatic of loss of endogenous RNA, as the same amount of spike-in RNA should have been added to each cell
To identify which barcodes are of low quality, we assume that most cells are of high-quality and detect outliers from the distributions of the various metrics. We mark a barcode as an outlier if its corresponding value is more than three MADs (median absolute deviation) below / above the median value of that metric. Such a filter retains approximately 99% of values following a normal distribution.
Count-based filters
In this dialog of QC for Single Cell, the filters using the total number of reads and expressed features can be enabled and customized.
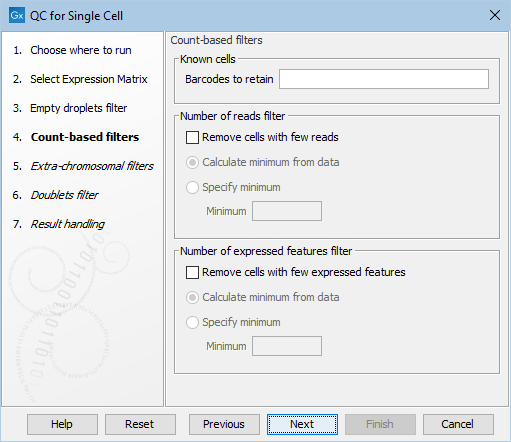
Figure 5.6: The default settings in the Count-based filters dialog.
The dialog first allows for manually specifying a list of barcodes to be retained as cells in Barcodes to retain (figure 5.6). These would typically be barcodes that are otherwise removed by any of the filters applied. See more details in Choosing barcodes to retain.
The following options can be adjusted for the Count-based filters (figure 5.6):
- Remove cells with few reads. Enables filtering based on the total number of reads.
- Remove cells with few expressed features. Enables filtering based on the total number of expressed features.
- For both filters, the outlier detection can be fine-tuned by selecting:
- Calculate minimum from data. Outliers are detected as being more than three MADs below the median.
- Specify minimum. Outliers are detected as being below the threshold specified in the Minimum parameter. This can be useful when the metric distribution is not normal.
Extra-chromosomal filters
In this dialog of QC for Single Cell, the filters using the proportion of reads mapped to mitochondria and spike-in controls can be enabled and customized.
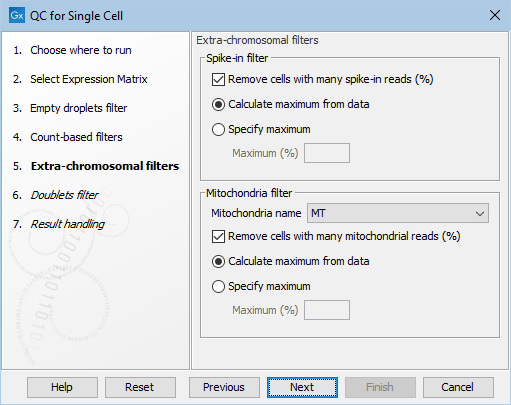
Figure 5.7: The default settings in the Extra-chromosomal filters dialog.
The following options can be adjusted in the Extra-chromosomal filters dialog (figure 5.7):
- Remove cells with many spike-in reads (%). Enables filtering based on the proportion of reads mapped to spike-in controls.
- Mitochondria name. The name of the mitochondria chromosome. Can be left empty if the organism does not have mitochondria.
- Remove cells with many mitochondrial reads (%). Enables filtering based on the proportion of reads mapped to mitochondria. It requires that the Mitochondria name is set.
- For both filters, the outlier detection can be fine-tuned by selecting:
- Calculate maximum from data. Outliers are detected as being more than three MADs above the median.
- Specify maximum. Outliers are detected as being above the threshold specified in the Maximum (%) parameter. This can be useful when the metric distribution is not normal.