MA plot
The MA plot is a scatter rotated by
You can create an MA plot comparing two samples:
Toolbox | Expression Analysis (![]() )| General Plots (
)| General Plots (![]() ) | Create MA Plot (
) | Create MA Plot (![]() )
)
In the first two dialogs, select two samples ( (![]() ), (
), (![]() ) or (
) or (![]() )): the first must be the case expression data, and the second the control data. Clicking Next will display a dialog as shown in figure 23.58.
)): the first must be the case expression data, and the second the control data. Clicking Next will display a dialog as shown in figure 23.58.
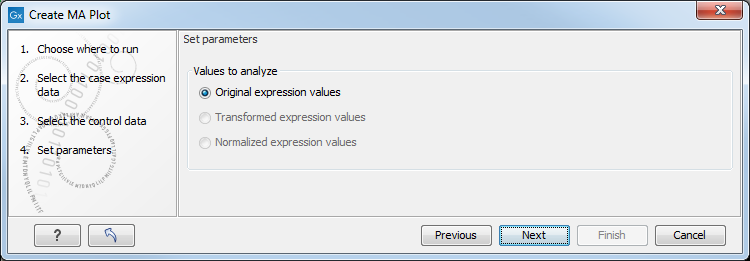
Figure 23.58: Selecting which values the MA plot should be based on.
In this dialog, you select the values to be used for creating the MA plot (see Selecting transformed and normalized values for analysis).
Click Finish to start the tool.
Subsections