Working with tables
Tables are used in a lot of places in the CLC Genomics Workbench. There are some general features for all tables, irrespective of their contents, that are described here.
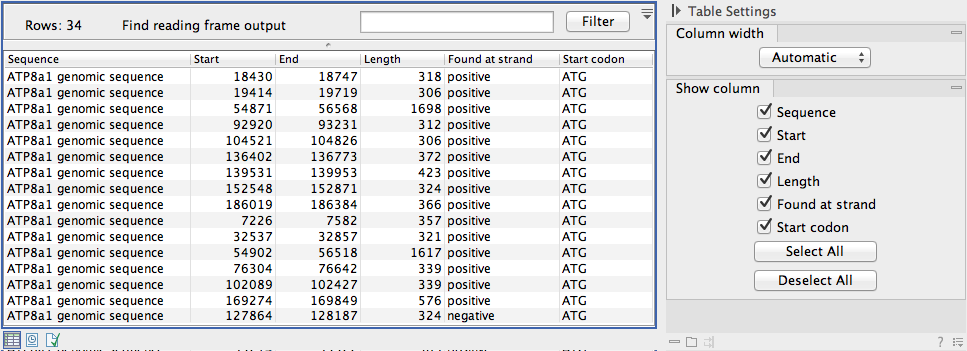
Figure 3.24 shows an example of a typical table. This is the table result of Find Open Reading Frames (![]() ). We use this table as an example to illustrate concepts relevant to all kinds of tables.
). We use this table as an example to illustrate concepts relevant to all kinds of tables.

Figure 3.24: A table showing the results of an open reading frames analysis.
Table viewing options
Options relevant to the view of the table can be configured in the Side Panel on the right.
For example, the columns that can be dispalyed in the table are listed in the section called Show column. The checkboxes allow you to see or hide any of the available columns for that table.
The Column width can be set to Automatic or Manual. By default, the first time you open a table, it will be set to Automatic. The default selected columns are hereby resized to fit the width of the viewing area. When changing to the Manual option, column widths will adjust to the actual header size, and each column size can subsequently by adjusted manually. When the table content exceeds the size of the viewing area, a horizontal scroll becomes available for navigation across the columns.
Sorting tables
You can sort table according to the values of a particular column by clicking a column header. (Pressing Ctrl - ![]() on Mac - while you click will refine the existing sorting).
on Mac - while you click will refine the existing sorting).
Clicking once will sort in ascending order. A second click will change the order to descending. A third click will set the order back its original order.
Subsections
