Mapped reads coloring
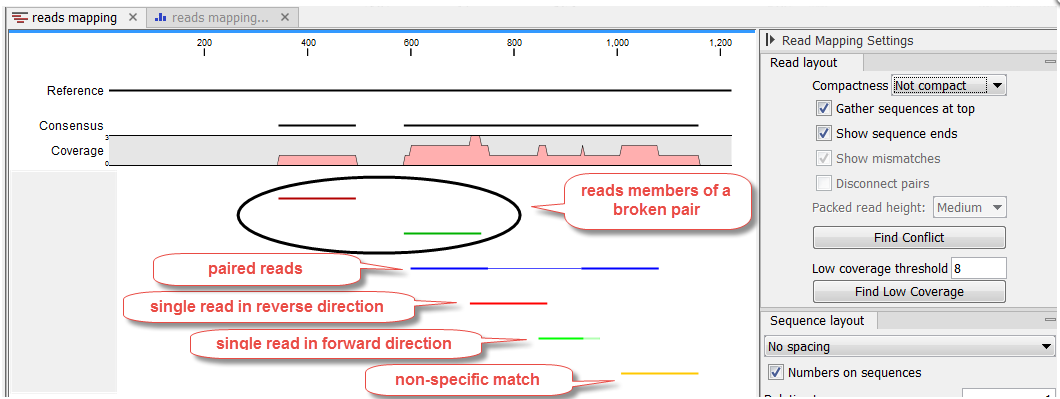
The mapped reads are colored by default according to the following color code:
- Single reads mapping in their forward direction are green.
- Single reads mapping in their reverse direction are red.
- Paired reads are blue. The thick line represents the read itself; the thin line represents the distance between each read in the pair. Note that reads from broken pairs are colored according to their forward/reverse orientation or as a non-specific match.
- Non-specific matches are yellow. When a read would have matched equally well another place in the mapping, it is considered a non-specific match. This color will "overrule" the other colors. Note that when mapping to several reference sequences, i.e. chromosomes, a read is considered a double match when it matches more than once across all the chromosomes.
Unaligned ends, that is the part of the reads that is not mapped to the reference (also known as soft-clipped read ends) will be shown with a faded color, e.g. light green, light red, light blue or light yellow, depending on the color of the read.
In a stand alone read mapping, reads that are members of a broken pair are highlighted in darker shades of the read color, unless the Read layout is set to "Packed" (see figure 24.11). In a reads track, members of a broken pair are not highlighted in darker shades of the read color.

Figure 24.11: Default reads color for a stand alone read mapping when compactness is not set to "Packed".
In a stand alone read mapping, these default colors can be changed using the functionalities of the side panel (see Mapping view settings).
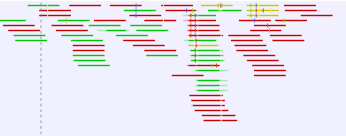
Mismatches between the read and reference are shown as narrow vertical traits following the Rasmol color scheme (figure 24.12):
- A - red.
- T - green.
- C - blue.
- G - yellow.

Figure 24.12: Mismatches between the reads and reference are shown as narrow vertical traits following the Rasmol color scheme.
When zooming in at the nucleotide level, any mismatches between the read and reference are shown in black with a background color highlighting according to the Rasmol color scheme (see figure 24.13).

Figure 24.13: At the nucleotide level, mismatches between the reads and reference are shown in black with a Rasmol background color. The overflow graph below the reads shows how many more forward or reverse reads cannot be displayed in the track. Expand the tracks to see all reads at the nucleotide level.
At this level, usually more reads are mapped to the reference than can be shown in the track. In such cases the reads will be displayed in an overflow graph below the reads. The overflow graph is shown in the same colors as the sequences, and mismatches in reads are shown as horizontal lines following the Rasmol color scheme.
If your read mapping or track shows the message 'Too much data for rendering' on a grey background, simply zoom in to see your reads in more detail. This occurs when there are too many reads to be displayed clearly. More specifically, where there are more than 500,000 reads displayed in a reads track, more than 200,000 reads displayed in a read mapping, or when the region being viewed in a read mapping is longer than 200,000 bases. Paired reads count as one in these cases.
