Output from the Identify Known Mutations from Sample Mappings tool
One individual sample output track will be created for each read mapping analyzed, while one overview track will be created per analysis (figure 25.91).
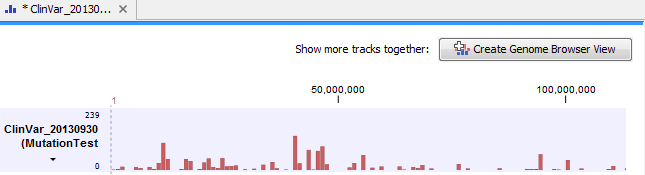
Figure 25.91: Overview track of read mappings tested against a Clinvar variant track.
At the bottom of the window it is possible to switch to a table view that lists all the mutations from the variant track that were found in your sample mapping.
In the individual track, the variant has been annotated with the following information:
- Chromosome
- Region
- Type SNV, MNV, Deletion, Insertion or Replacement
- Reference
- Allele
- Reference allele describes with a Yes or No whether the allele is similar to the reference.
- Length of the allele
- Zygosity Homozygous or Heterozygous (based on the parameter "Detection
frequency" setting)
- Count Number of reads supporting the variant.
- Coverage
- Frequency Frequency of the reads supporting the variant
- Forward read count
- Reverse read count
- Forward/Reverse balance Minimum ratio of forward and reverse reads supporting
the variant
- Average Quality Average quality of all bases supporting the variant
- Most frequent alternative allele (MFAA)
- MFAA count The Most Frequent Alternative Allele count (MFAA count) is the count of reads supporting the most frequent alternative
allele at the position of the variant
- MFAA frequency Frequency of reads supporting the most frequent
alternative allele at the position of the variant
- MFAA forward read count forward reads supporting the most frequent
alternative allele at the position of the variant
- MFAA reverse read count reverse reads supporting the most frequent
alternative allele at the position of the variant
- MFAA forward/reverse balance forward/reverse balance of the most
frequent alternative allele at the position of the variant
- MFAA average quality average quality of the most
frequent alternative allele at the position of the variant
- ("Sample name") coverage Either Yes or No, depending on whether the coverage at the position of the variant was higher or lower than the user given threshold for minimum coverage.
- ("Sample name") detection Either Yes or No, depending on the minimum frequency settings chosen by the user.
- ("Sample name") frequency The variant frequency observed in this sample.
- ("Sample name") zygosity The zygosity observed in the sample. This
setting is based on the minimum frequency setting made by the user. If this
variant has been detected and the most frequent alternative allele at this
position is also over the cutoff, the value is heterozygote.
An example of the individual and overview tables can be seen in figure 25.92.
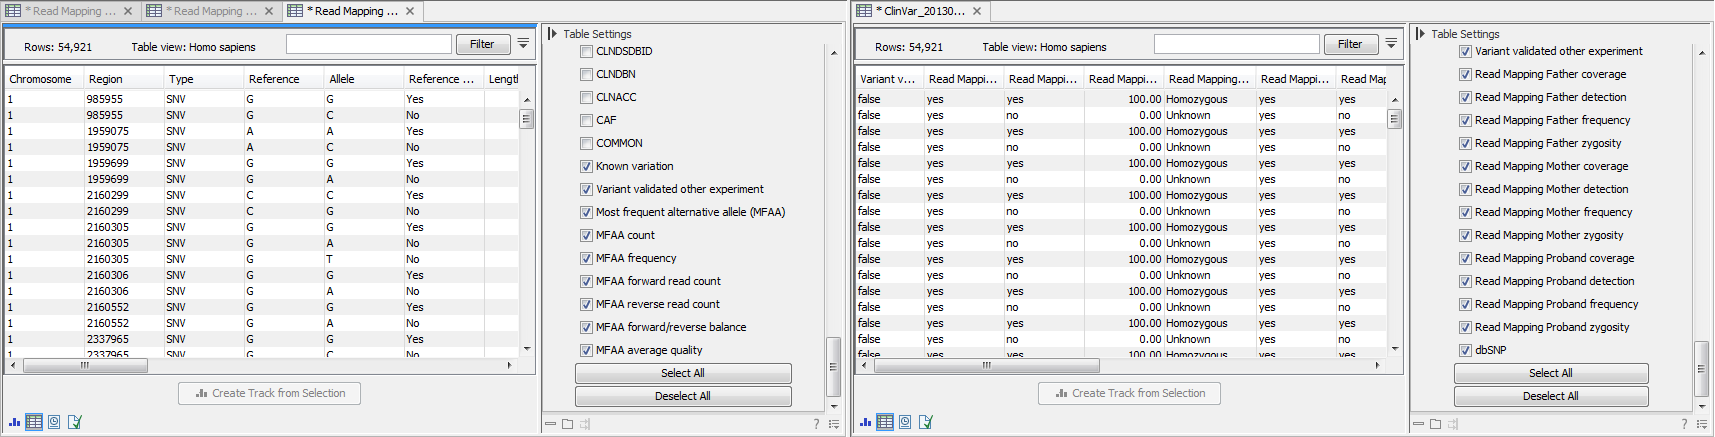
Figure 25.92: Table views of the individual track (left) and overview track (right).