BLAST hit table
The BLAST Hit table view can be shown in the following way:
Click the Show BLAST Hit Table button (![]() ) at the
bottom of the view
) at the
bottom of the view
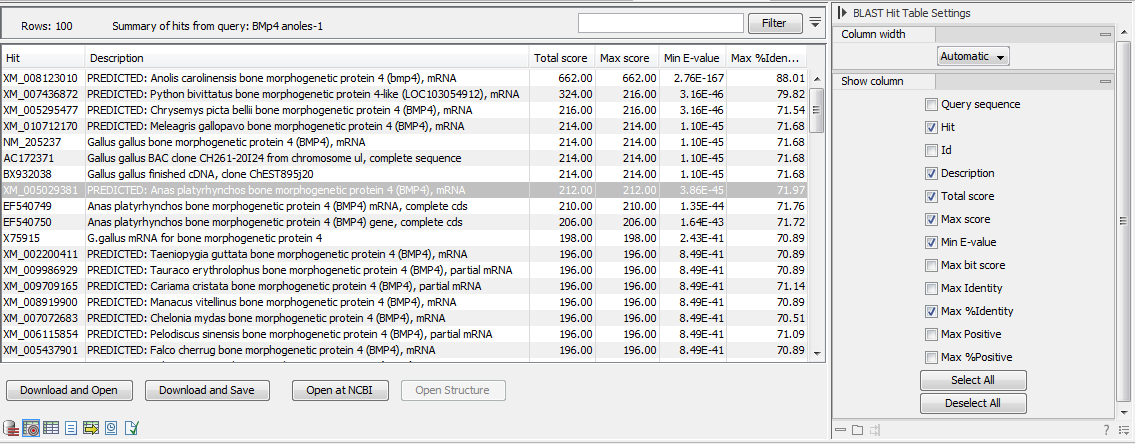
Figure 11.12 is an example of a BLAST Hit Table.

Figure 11.12: BLAST Hit Table. The hits can be sorted by the different columns, simply by clicking the column heading.
The BLAST Hit Table includes the following information:
- Query sequence. The sequence which was used for the search.
- Hit. The Name of the sequences found in the BLAST search.
- Id. GenBank ID.
- Description. Text from NCBI describing the sequence.
- Total Score. Total score for all HSPs.
- Max Score. Maximum score of all HSPs.
- Min E-value. Minimum e-value of all HSPs.
- Max Bit score. Maximum Bit score of all HSPs.
- Max Identity. Shows the maximum number of identical residues in the query and Hit sequence.
- Max %Identity. Shows the percentage of maximum identical residues in the query and Hit sequence.
- Max Positive. Shows the maximum number of similar but not necessarily identical residues in the query and Hit sequence.
- Max %Positive. Shows the percentage of maximum similar but not necessarily identical residues in the query and Hit sequence.
