Data structures for transcriptomics
The two main data structures used for transcriptomics data analysis in the CLC Genomics Workbench are tracks and experiments.
Tracks (see Tracks) are the fundamental building blocks for data analysis in the CLC Genomics Workbench, where all information is tied to genomic positions. A central coordinate-system is provided by a reference genome, which allows that different types of data or results for different samples can be seen and analyzed together.
Experiments (see Experiments), on the other hand, are used to represent complex relationships between expression samples, and to carry out statistical analysis (see statistical analysis) of differential expression.
Tracks and experiments are intimately related, and it is possible in most cases to convert from one type to the other.
When carrying out RNA-seq analysis using the RNA-Seq Analysis tool, the starting point is a set of reads from a sequencing study. As part of the RNA-Seq Analysis tool, these reads are mapped onto a reference genome. The RNA-Seq tool produces expression tracks, which are compatible with the reference genome, and can be visualized together with the genome in the Track List View (see Tracks).
You can find more information about the RNA-Seq Analysis tool in RNA-Seq Analysis.
Once expression tracks have been obtained from the RNA-Seq Analysis tool, they can be used as sequencing-based sets of expression values in setting up an experiment. This can be done using the Set up Experiment tool and it is described in more detail in Experiments.
- Use the Set up Experiment tool on two or more expression tracks to set up an experiment, as described in Experiments.
- Save and open the resulting experiment, by double-clicking its name in the Navigation Area.
- Use the Create Track List tool to create a track list from the expression tracks you used to set up the experiment, as described in Tracks.
- Save and open the resulting track list by double-clicking its name in the Navigation Area.
- Drag the experiment tab downwards, until you see the blue shadow indicating the resulting placement (figure 27.37), and drop it in place. You should now have a divided view, with the experiment in the bottom half (figure 27.38).
- Clicking on any line in the experiment will now automatically jump to the corresponding genomic location in the upper view. Use the Zoom to Selection (
 ) button to zoom in to the desired genomic region.
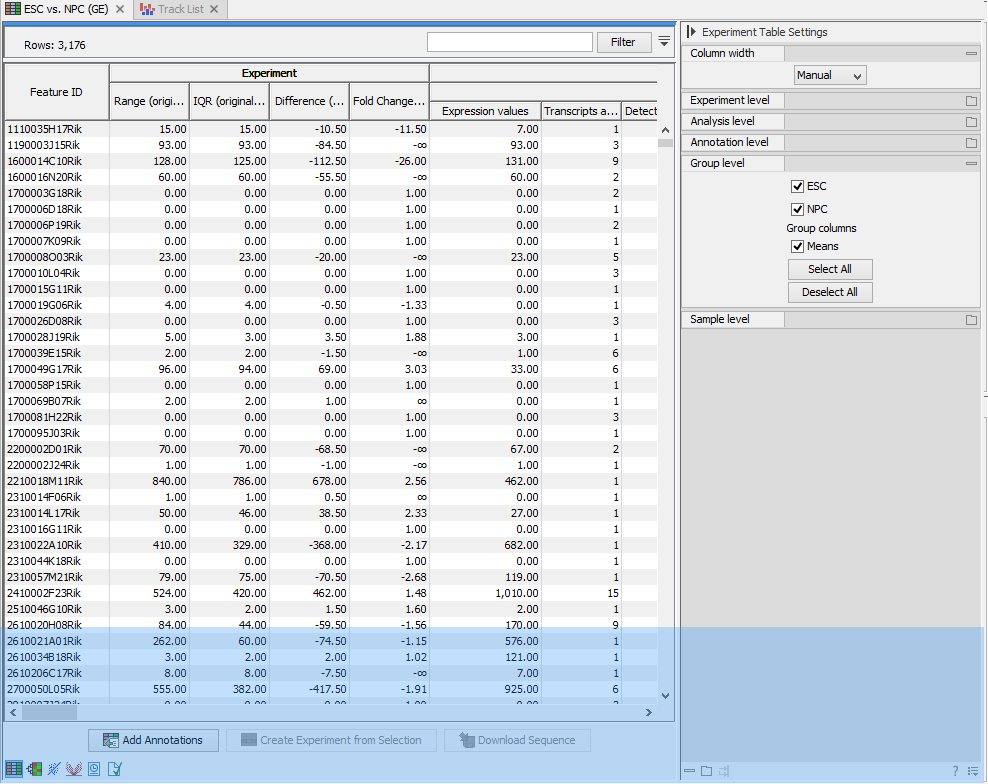
Figure 27.37: Dragging a tab to the lower half of the view area.
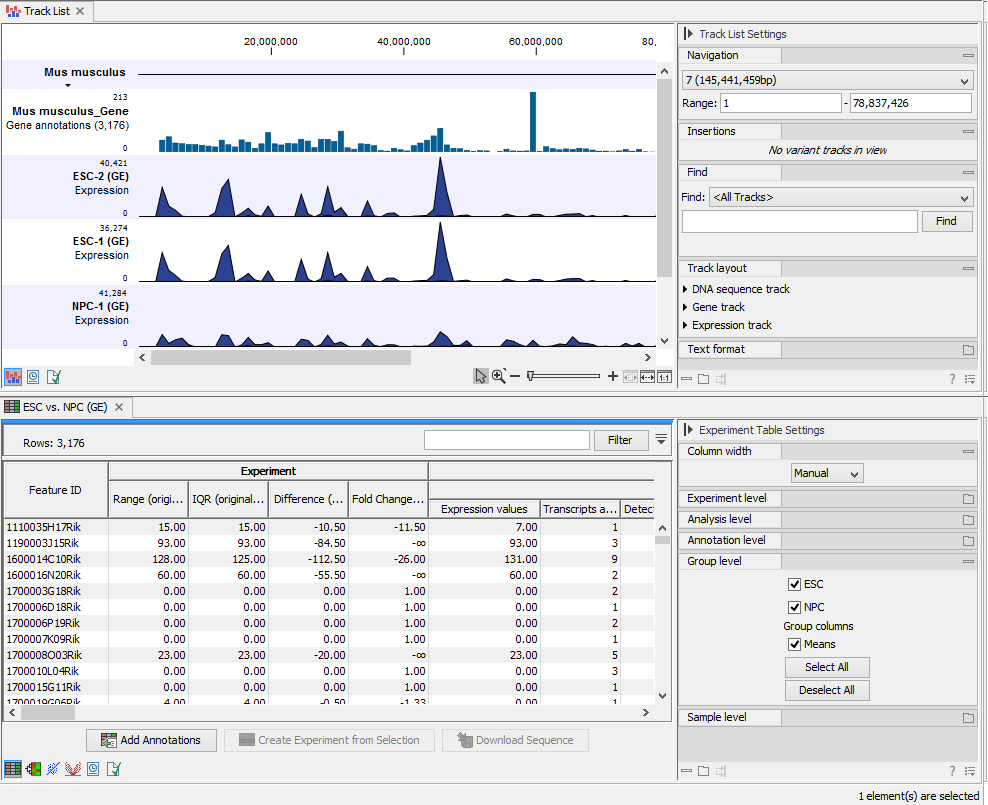
Figure 27.38: After dropping a tab to the lower half othe view area.
Experiments can be used to carry out statistical analysis on the expression values obtained from RNA-seq analysis as described in statistical analysis. The results of the statistical analysis are annotated on the experiment as additional columns.
It can be advantageous to visualize the results of the statistical analysis as tracks. The Create Track from Experiment tool in the CLC Genomics Workbench enables the conversion of experiments to tracks.