Output from the Perform QIAseq FastSelect RNA Expression and Fusion Calling (N6-T RT + ODT-RT primer) workflow
The Perform QIAseq FastSelect RNA Expression and Fusion Calling (N6-T RT + ODT-RT primer) workflow produces outputs as shown in figure 12.3. The figure shows the results of using the workflow on two samples.
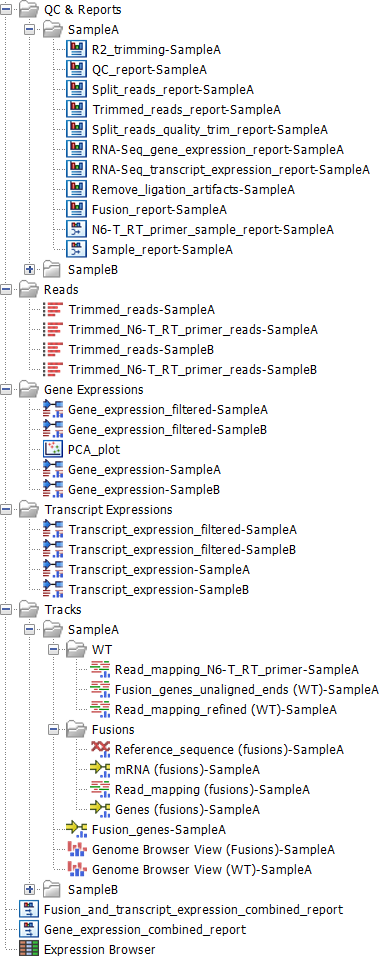
Figure 12.3: Output from the Perform QIAseq FastSelect RNA Expression and Fusion Calling (N6-T RT + ODT-RT primer) workflow when run with two samples.
An Expression Browser (![]() ) tabulates the transcript level expressions of all the samples.
) tabulates the transcript level expressions of all the samples.
The Fusion_and_transcript_expression_combined_report (![]() ) and Gene_expression_combined_report (
) and Gene_expression_combined_report (![]() ) summarize all the reports generated for all the samples during the named analyses.
) summarize all the reports generated for all the samples during the named analyses.
The QC & Reports folder provides detailed reports (![]() ) for individual tools run in the workflow. There is one subfolder per sample. Reports of special interest are:
) for individual tools run in the workflow. There is one subfolder per sample. Reports of special interest are:
- RNA-Seq_gene/transcript_expression_report A graphical report of the RNA-seq analysis. See http://resources.qiagenbioinformatics.com/manuals/clcgenomicsworkbench/current/index.php?manual=RNA_Seq_report.html.
- Fusion_report A graphical report of the fusions found in the sample. For more details see Detect and Refine Fusion Genes report.
- Sample_report A summary of the reports generated when processing all the reads for gene expression analysis.
- NT-6_RT_primer_sample_report A summary of the reports generated when processing the N6-T RT primer reads for transcript expression and fusion analyses.
The Reads folder contains the reads used in the downstream analysis. The files called "Trimmed_reads" contain both N6-T RT primer reads and ODT-RT primer reads. The files called "Trimmed_N6-T_RT_primer_reads" contain the N6-T RT primer reads.
The Gene Expressions and Transcript Expressions folders contain two types of Expression Track (![]() ) - one at the gene level and one at the transcript level. A "filtered" copy of these tracks is also provided. The filtered tracks are limited to genes/transcripts that are annotated as being "protein coding" or "lncRNA". Further details about this track type can be found at http://resources.qiagenbioinformatics.com/manuals/clcgenomicsworkbench/current/index.php?manual=Expression_tracks.html.
) - one at the gene level and one at the transcript level. A "filtered" copy of these tracks is also provided. The filtered tracks are limited to genes/transcripts that are annotated as being "protein coding" or "lncRNA". Further details about this track type can be found at http://resources.qiagenbioinformatics.com/manuals/clcgenomicsworkbench/current/index.php?manual=Expression_tracks.html.
Within the Gene Expressions folder is a PCA plot. This will be empty if there is only a single sample. When there are multiple samples, the clustering in the PCA plot can be used for quality control. For more details on PCA plots see http://resources.qiagenbioinformatics.com/manuals/clcgenomicsworkbench/current/index.php?manual=PCA_RNA_Seq.html.
The Tracks folders contain the results of fusion calling. There is one subfolder per sample. The results are split into two parts - the "WT" (wildtype) chromosomes, showing reads that align to the reference genome, and the "Fusions" chromosomes showing reads that preferentially align to the fusion products. All the data for the wildtype and fusion chromosomes can be viewed by opening the "Genome Browser View (WT)" (![]() ) and "Genome Browser View (Fusions)" (
) and "Genome Browser View (Fusions)" (![]() ) respectively. These show the data in the "WT" and "Fusions" folders. For quality control of fusion calls, see Interpretation of fusion results. We particularly recommend carrying out manual quality control checks on results that include fusions with novel exon boundaries.
) respectively. These show the data in the "WT" and "Fusions" folders. For quality control of fusion calls, see Interpretation of fusion results. We particularly recommend carrying out manual quality control checks on results that include fusions with novel exon boundaries.