Expression tracks
Expression tracks can be shown in a Table (![]() ) and a Track (
) and a Track (![]() ) view.
) view.
The expression track table view has the following options (figure 33.53).
- The "Filter to selection" only displays pre-selected rows in the table.
- The "Create track from Selection" will create a new Track with the selected rows.
- The "Select Genes/Transcripts in Other Views" button finds and selects the currently selected genes or transcripts in all other open expression track table views.
- The "Copy Gene/Transcript Names to Clipboard" button copies the currently selected gene or transcript names to the clipboard.
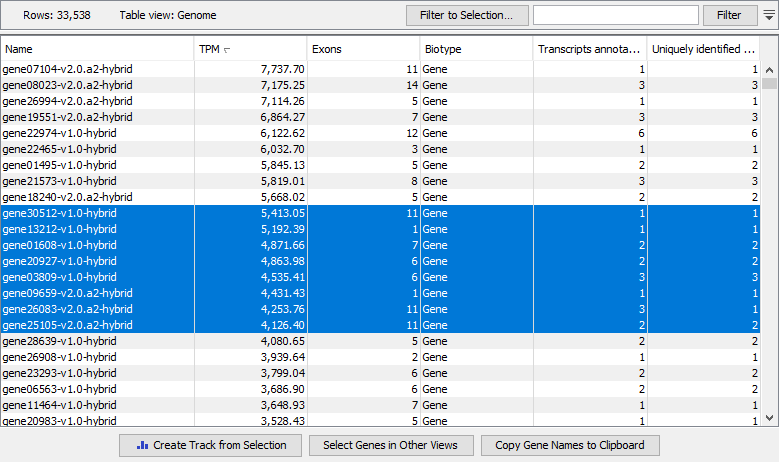
Figure 33.53: A gene-level expression track shown in Table view.
For detailed information on expression tracks, see Expression tracks.