Create Combined miRNA Report
Create Combined miRNA Report combines all reports from miRNA related tools (including the Biomedical Genomics Analysis tool Create UMI Reads for miRNA https://resources.qiagenbioinformatics.com/manuals/biomedicalgenomicsanalysis/current/index.php?manual=Create_UMI_Reads_miRNA.html) across multiple samples into a single report. This is to provide a better overview of samples in the experiment and to more easily perform quality control. The tool should be run on samples that are created using the same parameters. Samples with the same name will be merged.
To start the tool, go to:
Tools | RNA-Seq and Small RNA Analysis (![]() )| miRNA Analysis (
)| miRNA Analysis (![]() ) | Create Combined miRNA Report (
) | Create Combined miRNA Report (![]() )
)
In the first dialog, select the reports to be merged (at least 2). Click Next to choose whether you wish to use short aliases (*S1, S2, etc...) or the full sample names in the headers of the tables. This is merely a question of readability of the resulting report.
From the UMI reads report, the UMI statistics section is extracted. From the miRNA Quantification Report spike-ins are consolidated in a single correlation table (figure 33.28). The color in the table represents the strength of the correlation. Below 0.95, the table entry is colored red; Between 0.95 and 0.99, the table entry will be green. A correlation higher than 0.99 will lead to a gray entry, as this result can be considered suspiciously high.
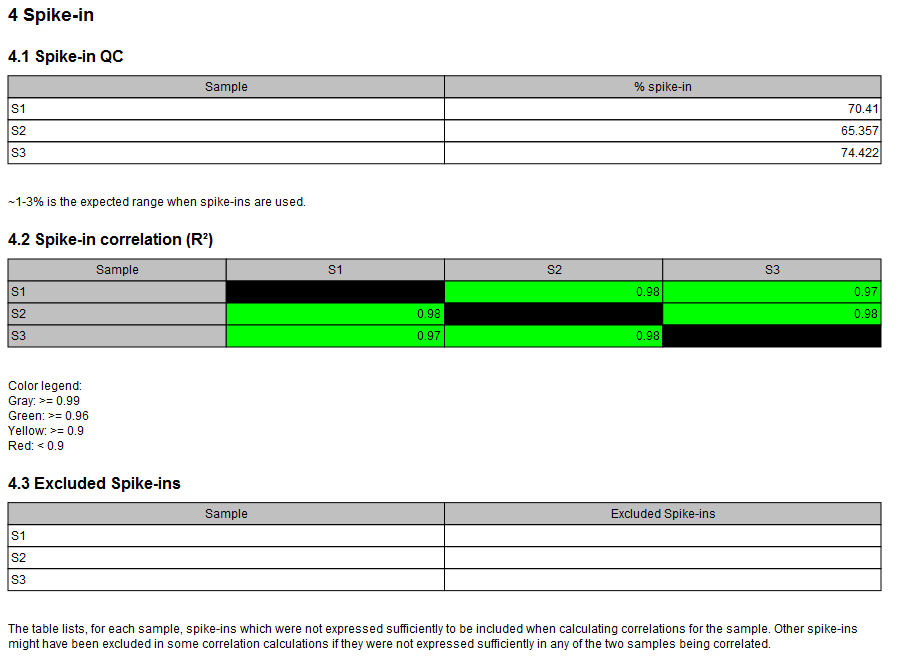
Figure 33.28: The combined report includes a table of the Top 20 mature sequences for all samples. A question mark ? indicates when a feature is not among the top 20 mature sequences from a particular sample.
When combining different samples report, a table will compile the top 20 mature sequences (figure 33.29), and another table for the Top non-miRNA sequences when one was provided.
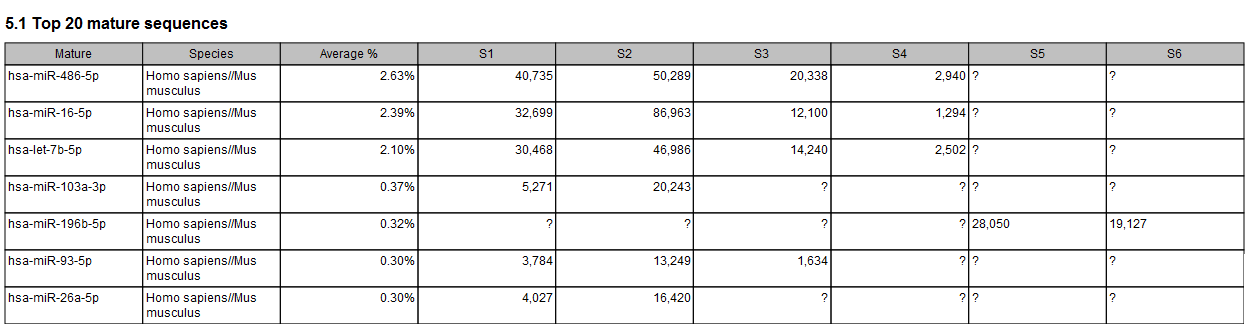
Figure 33.29: The combined report includes a table of the Top 20 mature sequences for all samples. A question mark ? indicates when a feature is not among the top 20 mature sequences from a particular sample.
In the Seeds report section, tables recapitulate the top 20 seeds (when any) and top 20 novel seeds with counts for the different samples (as seen in figure 33.30).
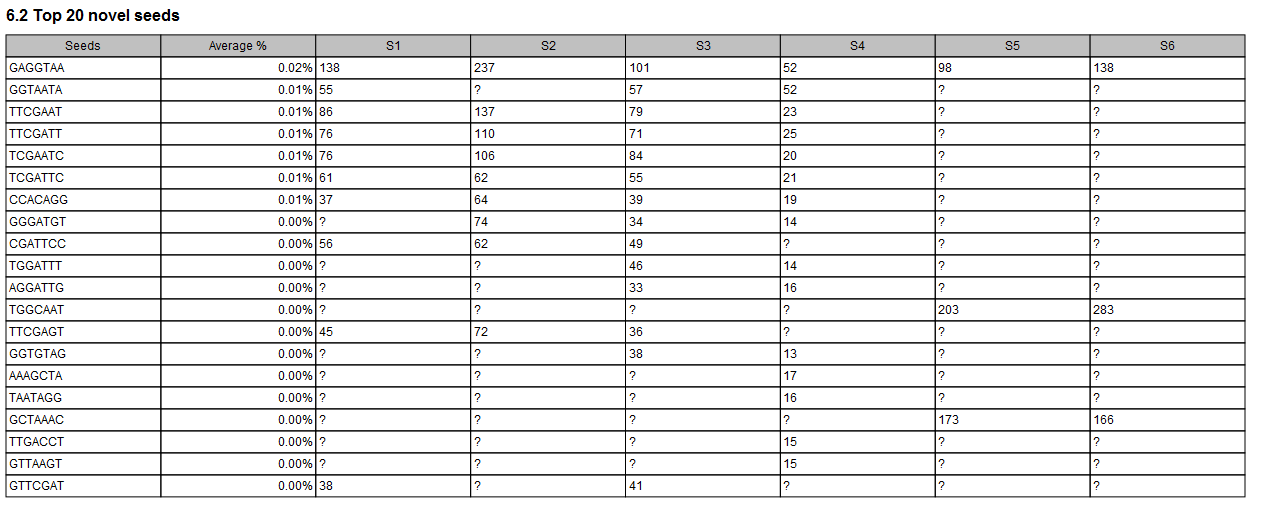
Figure 33.30: The combined report includes a table of the Top 20 novel seeds for all samples. A question mark ? indicates when a feature is not among the top 20 novel seeds from a particular sample.