Create GC Content Graph
Create GC Content Graph takes a sequence track as input and creates a graph track of the GC content of that sequence, using a window size specified when launching the tool.
To run the tool, go to:
Toolbox | Utility Tools (![]() ) | Tracks (
) | Tracks (![]() ) | Graphs (
) | Graphs (![]() ) | Create GC Content Graph (
) | Create GC Content Graph (![]() )
)
A sequence track is selected as input (figure 27.29) and a window size is specified (figure 27.30). The window size is the region size over which the GC content is calculated. For example, with a window size of 25, the GC content would be calculated for a region comprised of a central base plus the 12 bases upstream and the 12 bases downstream of it. As there is a single central base, the window size must be an odd number.
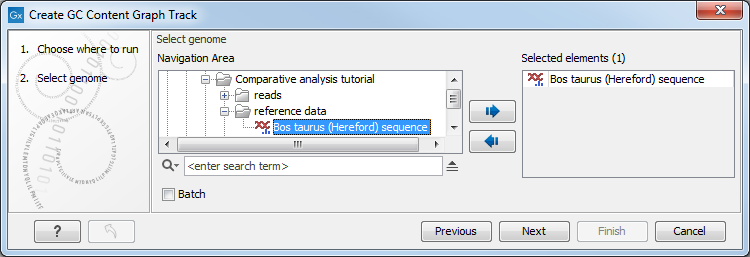
Figure 27.29: Select a sequence track as input to Create GC Content Graph.
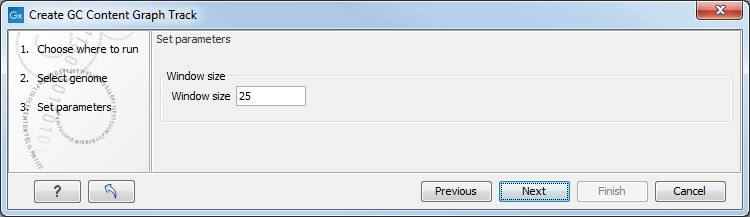
Figure 27.30: Specify the window size. The window size is the region around each individual base that should be used to calculate the GC content in a given region.
The output is a graph track (figure 27.31). There is one GC content value for each base. When zoomed out fully, three graphs are visible. The top graph (darkest blue) represents the maximum observed GC content values. The middle graph (intermediate blue color) shows the mean observed GC content values in the region. The bottom graph (light blue color) shows the minimum observed GC content values.
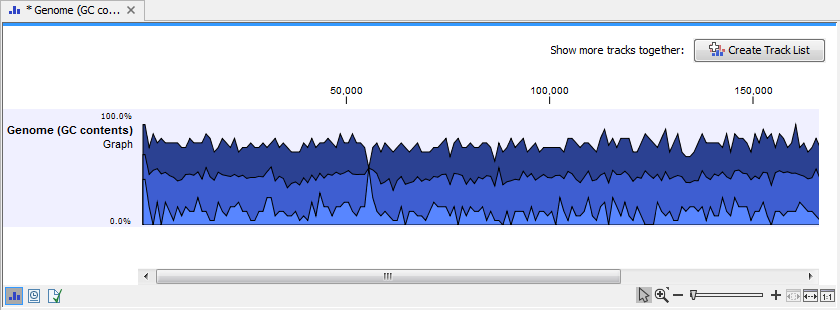
Figure 27.31: The output from Create GC Content Graph is a graph track. The graph track shows one value for each base with one graph being available for each chromosome.
When zoomed in to the single nucleotide level, one graph is visible. Hovering the mouse over an individual base reveals a tooltip with the GC content for the window, considering the specified base as the central base of that window (figure 27.32).
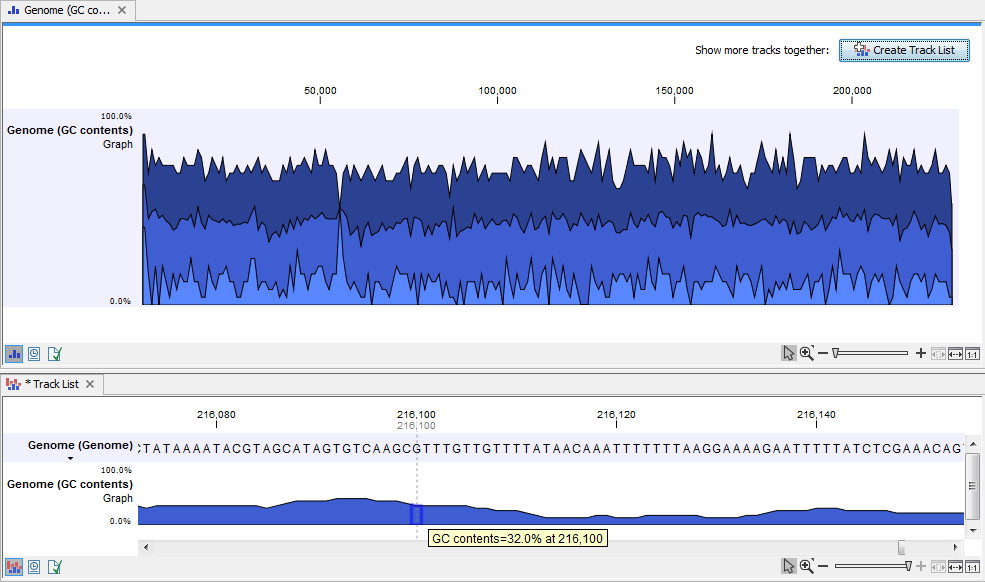
Figure 27.32: Top image: the graph track when zoomed all the way out. Bottom image: A track list containing a graph track and a genome sequence, zoomed in to the single nucleotide level. The mouse cursor has been placed over a nucleotide, revealing a tooltip showing the the GC content for the window where this base is the central base. Here, the windows size was 25 nucleotides, so the GC content shown is for the selected nucleotide plus the 12 bases upstream and 12 bases downstream of that nucleotide.