Output of the Differential Expression tools
Differential expression tools output one or more statistical comparison tracks or tables.
It can often be useful to collect all samples in an expression browser (Create Expression Browser), and visualize it alongside the statistical comparison, see Arrange views in View Area.
Statistical comparisons have a number of views (figures 33.89 and 33.90), displaying information about the performed test in different formats:
- Table (
 )
)
- Track (
 )
)
- Volcano plot (
 )
)
Using tracks differential expression results can be stacked with data of different types based on a compatible genome, and linked viewed opened. See Track lists. See also Working with tracks for details about working with individual tracks.
Note that the track view is not available for statistical comparison tables.
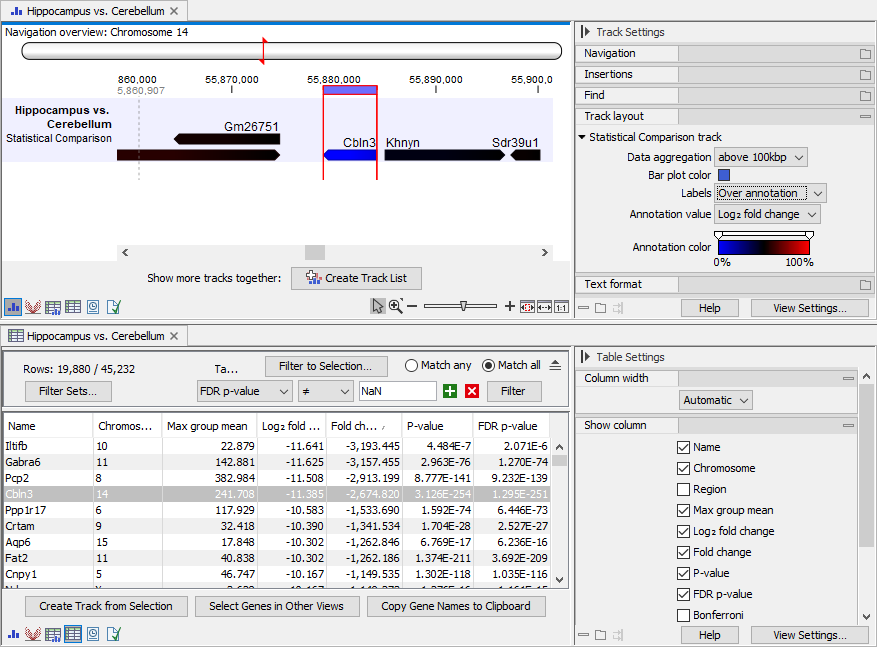
Figure 33.89: Views of a statistical comparison. Top: Track view. Bottom: Table view. The views are linked: selecting a feature in one view, also selects the feature in the other view.
The statistical comparison table offers, for each feature, the following
- Max group mean. For each group in the statistical comparison, the average TPM is calculated. This value is the maximum of the average TPM's.
- -log2 fold change. The logarithmic fold change.
- Fold change. The (signed) fold change: the relative expression between the groups. Features that are not observed in any sample have undefined fold changes and are reported as NaN (not a number).
The fold change is estimated using the GLM model. It is not possible to derive the fold change from the expression values by simple algebraic calculations.
- P-value. Standard p-value. Features that are not observed in any sample have undefined p-values and are reported as NaN (not a number).
- FDR p-value. The false discovery rate corrected p-value. This is calculated directly from the values in the P-value column.
- Bonferroni. The Bonferroni corrected p-value. This is calculated directly from the values in the P-value column.
Note that NaN p-values are not considered when calculating the FDR and Bonferroni corrected p-values.
At the bottom of the table view, the following buttons are available:
- Create Track/Table from Selection. Creates a track/table using the selected features.
- Select Genes/Transcripts in Other Views. Selects the currently selected features in all other opened views containing the same features, for example another view of the statistical comparison, or an expression browser (Create Expression Browser).
- Copy Gene/Transcript Names to Clipboard. Copies the names of the selected features to the clipboard.
Volcano plots
The volcano plot (figure 33.90) shows the relationship between the fold changes and p-values. The log2 fold changes and -log10 p-values are plotted on the x- and y-axis, respectively. Features of interest are typically those with large fold changes (far from ![]() ) that are statistically significant, i.e. have small p-values (far from
) that are statistically significant, i.e. have small p-values (far from ![]() ). They are located in the upper left (down-regulated) and upper right (up-regulated) hand corners of the volcano plot.
). They are located in the upper left (down-regulated) and upper right (up-regulated) hand corners of the volcano plot.
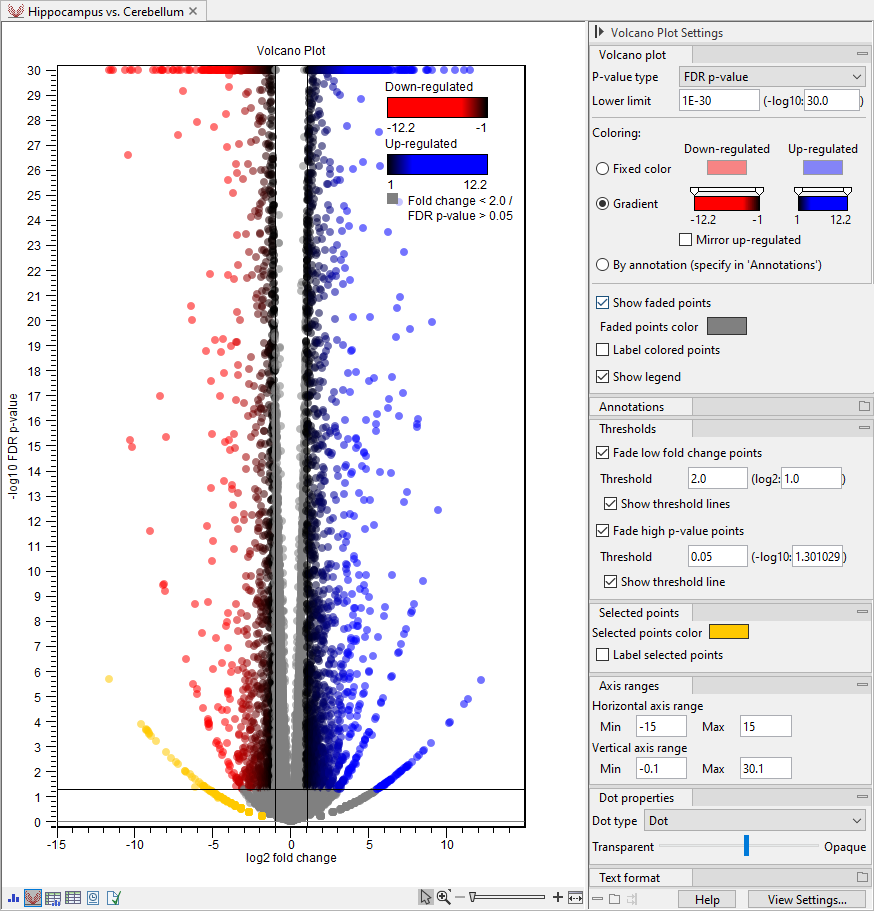
Figure 33.90: Customized volcano plot. Features are colored using gradients and those with low fold changes or high p-values are faded. The legend is shown in the upper right corner. The plot uses transparency for better visualization of overlapping points. Features in the bottom left corner are selected to highlight a "wing" pattern. The horizontal axis range is adjusted to center the plot.
Volcano plots can exhibit unexpected patterns looking like "wings", such as the one in orange in the bottom left corner in figure 33.90. These patterns reflect the mathematical relationship between fold changes and p-values, which can be exposed when there are few replicates and expression is low in one condition. For example, expression counts for two genes might be (5,5) vs (0,0) and (5,6) vs (0,1). These two genes would appear in the same "wing". Two other genes with expression counts (5,5) vs (0,1) and (5,6) vs (0,1) would be in another "wing".
The following can be configured in the Side Panel:
Volcano plot. General options for configuring the content and coloring.
- P-value type. The standard p-value, FDR p-value or Bonferroni can be displayed in the plot.
- Lower limit. All p-values smaller than this number are rounded to this number. This allows very small values to be visualized on a logarithmic scale volcano plot. The limit can be input as linear or logarithmic.
- Coloring. The features in the volcano plot can be colored in different ways:
- Fixed color. Down-regulated features have one color, and up-regulated features have another.
- Gradient. Down-regulated features have one gradient, and up-regulated features have another gradient. Gradients reflect the fold change. The gradient for up-regulated features can be applied to the down-regulated features by checking Mirror up-regulated.
- By annotation. Features are colored using the annotations selected in the Annotations group, see below.
See Side Panel for how to change the colors and/or gradient.
- Show faded points. If checked, faded features are shown in the plot. Features are faded when
- They have small fold change and/or non-significant p-values, as configured in the Thresholds group, see below.
- They have an annotation that has not been chosen for coloring when coloring By annotations.
- Faded points color. The color of the faded points.
- Label colored points. If checked, points that are not faded are labeled using the feature name.
- Legend position. Choose whether to display a color legend and where. Note that the legend does not contain the selected points (see below).
Annotations. Options for coloring features using annotations (figure 33.91).
- Annotation type. The type of annotation to be used for coloring.
- Select annotations to color by. The search filed is used for finding relevant annotations. Adding a space lists all available annotations. Double-clicking or hitting enter on a selected search result adds the annotation for coloring at the bottom.
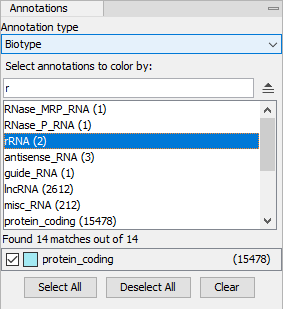
Figure 33.91: The Annotations group in the Side Panel. All biotype annotations containing "r" are shown, and protein coding features are colored using turquoise.
Thresholds. Options for fading features with small fold changes or non-significant p-values.
- Fade low fold change points. Fade features with absolute fold changes that are lower than the selected threshold.
- Threshold. The threshold can be input as linear or logarithmic.
- Show threshold lines. If checked, two vertical lines are drawn indicating the selected threshold and the corresponding negative value.
- Fade high p-value points. Fade features with p-values that are larger than the selected threshold.
- Threshold. The threshold can be input as linear or logarithmic.
- Show threshold line. If checked, a horizontal line is drawn indicating the selected threshold.
Selected points. Options for configuring selections.
Points in the volcano plot can be selected by
- Clicking on an individual point. Note that if there are multiple, overlapping points under the mouse cursor, just one of these points will be selected.
- Using the lass tool. With the left mouse button depressed, drag the cursor around the area of interest. Release the button to create the selection.
- Selected points color. The color of the selected points.
- Label selected points. If checked, selected points are labeled using the feature name.
Dot properties.
- Dot type. Each point is drawn using the chosen dot type.
- Transparency. The slider sets the transparency of the points and labels from opaque (right) to invisible (left). This can help visualize overlapping points.
Axis ranges. Options for configuring the ranges of the two axes.
- Horizontal axis range. Change the range of the horizontal axis (log2 fold change) by setting the Min and Max values.
- Vertical axis range. Change the range of the vertical axis (-log10 p-value) by setting the Min and Max values.
Note: When the potential number of labels is high, only a subset is shown. Zooming in and out may affect the labels shown.
The plot right-click menu offers the following options, for both Colored points and Selected points:
- Select Genes/Transcripts in Other Views. Selects the relevant features in all other opened views containing the same features, for example another view of the statistical comparison, or an expression browser (Create Expression Browser).
- Copy Gene/Transcript Names to Clipboard. Copies the names of the relevant features to the clipboard.