Identify Graph Threshold Areas
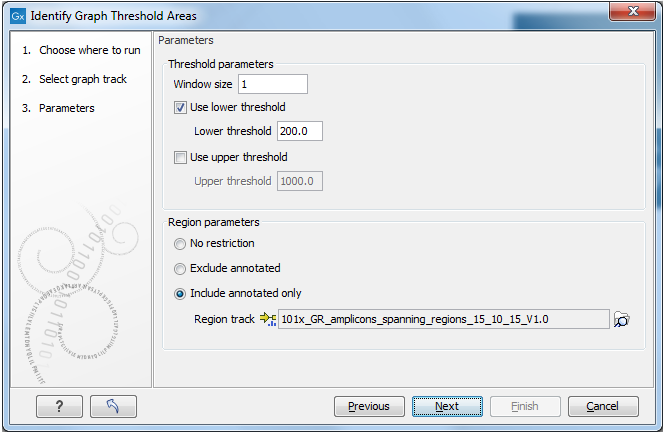
Identify Graph Threshold Areas identifies regions in a graph track that fall within specified thresholds. The output is a new track containing an annotation for each region that met the specified criteria (figure 27.42).
To run the tool go to:
Tools | Utility Tools (![]() ) | Tracks (
) | Tracks (![]() ) | Graph Tracks (
) | Graph Tracks (![]() ) | Identify Graph Threshold Areas (
) | Identify Graph Threshold Areas (![]() )
)
After providing a graph track as input, a lower threshold and an upper threshold can be specified, along with the window size to use.
The window size defines the size of the region over which an average value for each position should be calculated. It is these calculated values that are compared with the threshold(s) set. For example, with a window size of 100, each position is assigned the average of the values for the surrounding 100 positions.
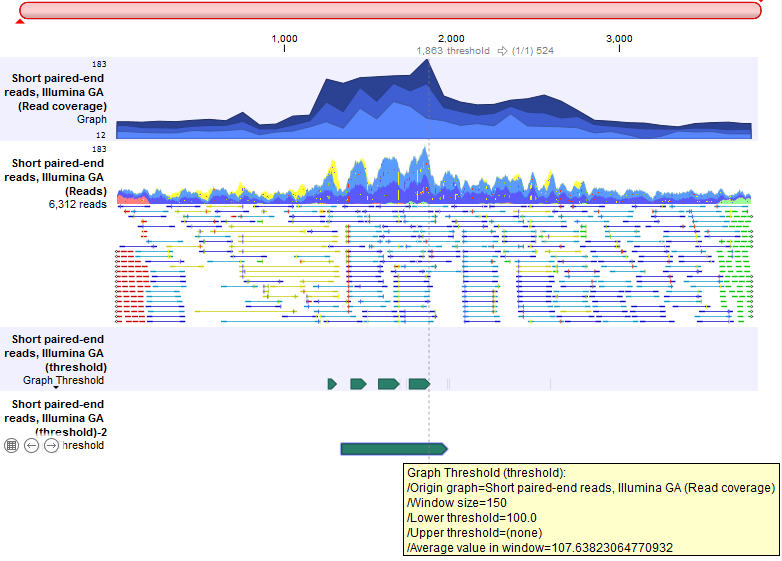
A window size of 1 results in the original value for every position being used for the comparison. However, a very small window size can lead to many small, fragmented regions being annotated. Larger window sizes can provide output that is more readily interpreted, and can help detect regions that may only be noticed when looking at the larger context with lower resolution. See figure 27.43.
Detection can be restricted to include or exclude certain regions. For this, a track with these regions must be provided.

Figure 27.42: Thresholds to meet and the window size to use, are specified when launching the tool. Optionally, the analysis can be restricted to include or exclude particular regions.

Figure 27.43: A Track List containing a read coverage graph, a reads track, and two threshold graphs containing annotations of regions where coverage in the mapping graph track was above 100. The upper threshold track was generated with a window size of 1 and contains several small annotations, revealing local minima in the coverage. The lower threshold track was generated using a window size of 150, resulting in a single, unbroken annotation covering the high coverage region.
