The Identify QIAseq DNA Ultra Somatic Variants template workflow
The Identify QIAseq DNA Ultra Somatic Variants template workflow supports analysis of Illumina QIAseq Ultra panel data. The ultra panels are designed to provide high coverage in targeted regions to allow identification of low frequency variants in cfDNA. As the read structure is different from standard QIAseq panels, the Identify QIAseq DNA Ultra Somatic Variants template workflow should only be used to process data from from QIAseq Ultra panels.
The Identify QIAseq DNA Ultra Somatic Variants workflow is set up to detect very low frequency variants. Please note that to call low frequency variants, coverage must be high. In low coverage samples or regions, very low frequency variants are unlikely to be represented in the reads.
The primers and target regions for the Ultra panels are available in the reference data set QIAseq DNA Ultra Panels hg38.
To run the workflow go to:
Template Workflows | Biomedical Workflows (![]() ) | QIAseq Panel Analysis (
) | QIAseq Panel Analysis (![]() ) | QIAseq DNA Workflows (
) | QIAseq DNA Workflows (![]() ) | Identify QIAseq DNA Ultra Somatic Variants (Illumina) (
) | Identify QIAseq DNA Ultra Somatic Variants (Illumina) (![]() )
)
You can then select the reads to analyze (figure 6.42).
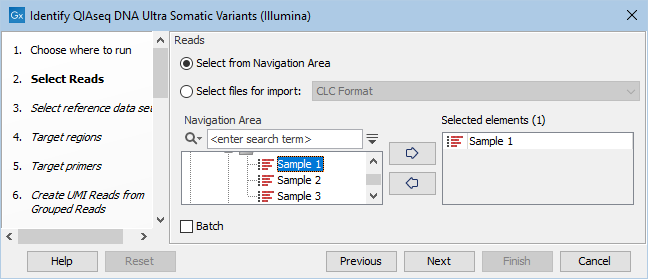
Figure 6.42: Choose the reads sequenced with an Ultra panel.
In the next dialog, check "Select a reference data set to use" and choose QIAseq DNA Ultra Panels hg38 (figure 6.43).
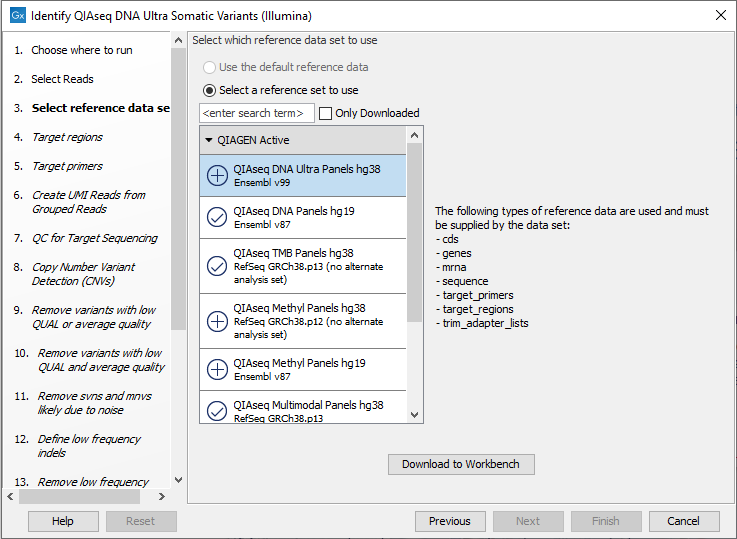
Figure 6.43: Choose the appropriate Reference Data Set.
In the Target regions dialog, select the panel specific target regions track (figure 6.44). Variants will only be detected within target regions.
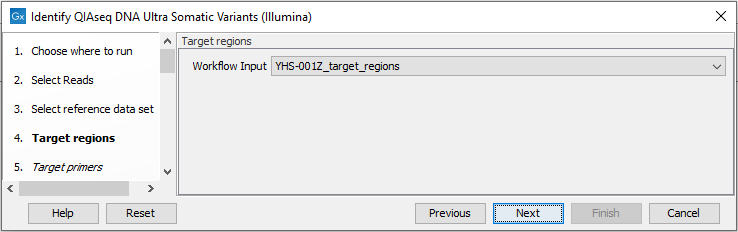
Figure 6.44: Choose the relevant Target regions track.
Repeat the selection of the appropriate track for Target primers in the subsequent dialog.
In the Create UMI Reads from Grouped Reads dialog, it is possible to specify settings for UMI grouping (figure 6.45).
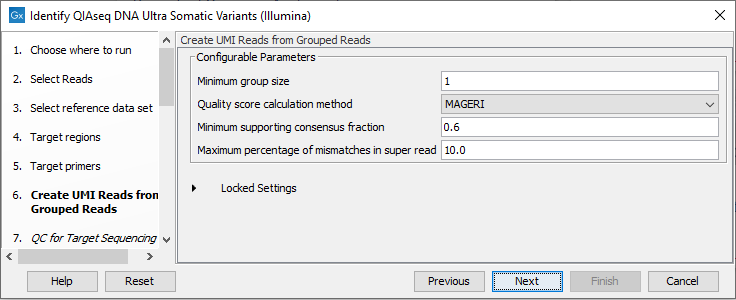
Figure 6.45: Configuring the settings for creation of UMI reads.
The QIAseq DNA Ultra data is expected to contain very large UMI groups and more PCR or sequencing errors may consequently be present in the UMIs compared to other sequencing protocols. Therefore, settings for grouping reads into UMI groups should be more relaxed than settings for standard panels. This is reflected in the default settings for Create UMI Reads from Grouped Reads in this workflow. See Create UMI Reads from Grouped Reads for details about UMI grouping using the tool Create UMI Reads from Grouped Reads.
In the QC for Target Sequencing dialog, specify the minimum coverage for QC (figure 6.46). Using default settings, samples where 90 percent of target region positions do not meet this threshold will be flagged in the Combined report generated by the workflow.
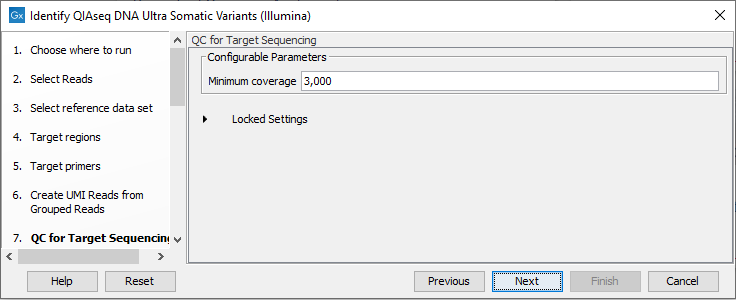
Figure 6.46: Configuring the QC for Target Sequencing tool.
The Copy Number Variant Detection (CNVs) dialog allows you to specify a control mapping against which the coverage pattern in your sample will be compared in order to call CNVs (figure 6.47). If you do not specify a control mapping the Copy Number Variation analysis will not be carried out.
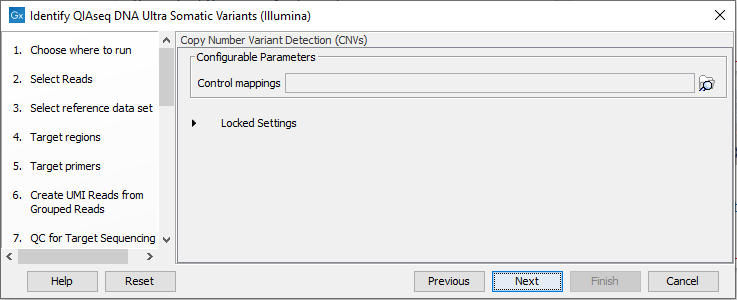
Figure 6.47: Select control mappings for the CNV detection tool.
Please note that if you want the copy number variation analysis to be done, it is important that the control mapping supplied is a meaningful control for the sample being analyzed. Mapping of control samples for the CNV analysis can be done using the workflow described in Create QIAseq DNA Ultra CNV Control Mapping.
A meaningful control must satisfy two conditions: (1) It must have a copy number status that is meaningful to compare against. For panels with targets on the X and Y chromosomes, the control and sample should be matched for gender. (2) The control read mapping must result from the same type of processing that will be applied to the sample.
In the event of dealing with low purity samples, e.g. cfDNA, we recommend consulting with How to interpret fold-changes when the sample purity is not 100% for an easy interpretation of true fold-changes based on observed fold-changes at different purities.
Next, set the variant quality filtering thresholds QUAL and Average quality (figure 6.48). Variants with quality below the specified thresholds will not be reported.
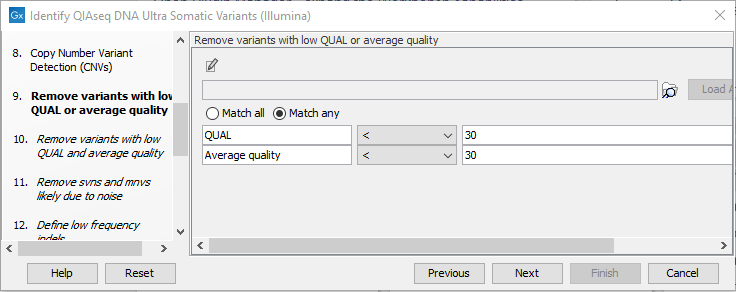
Figure 6.48: Specify quality threshold for filtering variants.
In the following wizard steps, it is possible to specify additional variant filtering criteria. When each of these have been set, choose where to save the results and press Finish to start the analysis.
Subsections
- Output from the Identify QIAseq DNA Ultra Somatic Variants template workflow
- Create QIAseq DNA Ultra CNV Control Mapping
- Output from the Create QIAseq DNA Ultra CNV Control Mapping template workflow