Detect MSI Status (beta)
The MSI solution design is based on the general idea that it is possible to detect whether a sample is stable or not by comparing it to a baseline composed of multiple microsatellite stable (MSS) samples. This comparison consists in evaluating (on a "per microsatellite locus" basis) whether the variations in the length distribution of the microsatellite observed in the test sample are generally the same as the variations observed in the baseline samples.
A microsatellite locus is said to be unstable when the length of the repeat region (e.g. tandem repeat of A nucleotides) is significantly different from the length in a normal sample. To measure the lengths in a sample, the following steps are used:
- For a given microsatellite locus, we find the flanking signature regions in the reference genome on both sides of the locus. The flanking signature region length is a parameter, which is set to 8 bp by default. For example, for the sequence ...CTGACTGCTGGAAAAAAAAAAAAAAAAAAAAAAAAAAAAAAATTTCGTAGCA... - where the sequence of repeated A's is the microsatellite - the left flanking signature is ACTGCTGG and the right flanking signature is TTTCGTAG.
- For every read that has an intersection with the locus (excluding broken pairs if desired), we check if the left and right flanking signatures can be found somewhere in the read. The process of searching for signatures may require an exact match or accept up to one mismatch.
- For every read with both flanking signatures, we calculate the number of base pairs between them and use this number to update a frequency distribution table of microsatellite locus lengths.
The Detect MSI Status (beta) then measures the statistical variation of the length distribution of each microsatellite locus and decides for each locus if it is stable or not by comparing the statistical variation of the test sample with the normal samples' baseline. If the proportion of unstable microsatellite loci is higher than a predefined threshold, then the sample is considered unstable.
To run the Detect MSI Status tool, go to:
Tools | QIAseq Panel Expert Tools | QIAseq DNA Panel Expert Tools (![]() ) | Detect MSI Status (beta) (
) | Detect MSI Status (beta) (![]() )
)
First, you will need to select a UMI read mapping (figure 3.27).

Figure 3.27: Specify a UMI read mapping for the Detect MSI Status.
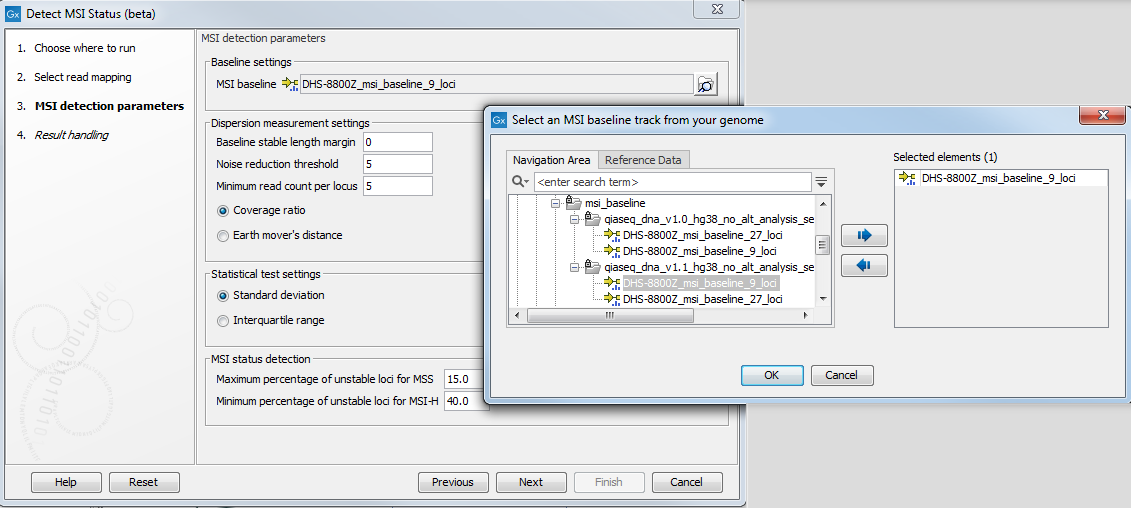
In the next dialog, specify a MSI baseline track (figure 3.28). It should be by default the msi_baseline_9_loci_v1 baseline.

Figure 3.28: Parameters for the Detect MSI Status.
|
MSI baseline tracks are created using the Generate MSI Baseline (beta) tool. Two ready-to-use baseline tracks are available in the Reference Data Manager: one is based on a 27 microsatellite loci track containing all the microsatellite loci covered by the primers in the Human TMB and MSI Panel (DHS-8800Z). This baseline was created using 30 MSS samples that were mapped to the hg38 (no alternaltive analysis set) reference sequence and processed with the Generate MSI Baseline (beta) tool using the default parameters. The other is a subset of the first containing 9 loci. These loci were identified utilising lung FFPE MSS and MSI samples and were found to perform consistently well during benchmarking. All 9 loci are mono nucleotide homopolymers. Note that the 27 loci baseline track should not be used for detecting MSI status. This baseline was included in the Reference Data Set so that users can select a subset of loci specific to a particular cancer type. To generate a cancer-specific baseline track, open the 27 loci baseline track along with the read mapping to investigate quality of the loci of interest. Then select them (in the table view of the track) and click on the Create Track from Selection button at the bottom of the table. Save the newly generated track in the Navigation Area.
|
The other parameters you can set are:
- Dispersion measurement settings. The reference length set may be adjusted to add length values that were not included by the peak factor method but are up to a certain number of bases away from the values of the reference length set. Then, to measure the statistical variation of a locus, we start with the length distributions of the baseline samples. Also, a filter is used to reduce the amount of noise in the test and baseline distributions. Subsequently, a locus length dispersion measurement is calculated for each sample using the reference length set and the corresponding distribution.
- Baseline stable length margin extends the baseline stable length by the selected margin value, from 0 to 2 base pairs. For example, if the reference length set is composed of the values 20, 21 and 29 and the baseline stable length margin parameter is set to 2, then the final set will also include the values, 18, 19, 22, 23, 27, 28, 30 and 31.
- Noise reduction threshold filters away read count lengths that do not reach the selected thresholds. The filter works by setting to zero any bin in the distribution that has less than the "Noice reduction threshold" parameter. Then, for each distribution, the peak factor method is used to select the reference length values for the sample. Given a peak factor (which is set to 75% by default), select all length values with frequencies that correspond to at least 75% the frequency of the peak of the distribution. After selecting the length values for each baseline sample, the reference length set is created by combining all length values selected among the baseline samples.
- Minimum read count per locus defines the minimum number of reads required for a given locus for this locus to be considered testable.
- Coverage ratio measures the proportion of reads that are covered by the reference length set, which is inversely correlated with how much a sample normally deviates from the reference set. This metric is measured by simply summing the ratio of the distribution that falls into the bins given by the reference set and is recommended for homogeneous baselines.
- Earth mover's distance, correlated with the dispersion from the reference set and it increases linearly with the distance from the reference set. The value of the metric is obtained by calculating, for each bin that is not in the reference set, the distance from the bin to the closest reference length bin and multiplying this distance times the ratio of the bin and accumulating to get the result. It is recommended for heterogeneous baselines.
- Baseline stable length margin extends the baseline stable length by the selected margin value, from 0 to 2 base pairs. For example, if the reference length set is composed of the values 20, 21 and 29 and the baseline stable length margin parameter is set to 2, then the final set will also include the values, 18, 19, 22, 23, 27, 28, 30 and 31.
- Detection method settings. The locus length dispersion is measured for each locus of each sample (test and baseline samples). Therefore, at the end of this step, for each locus, there will be a dispersion value for the test sample and a set of dispersion values for the baseline samples. At this point, the tool uses a statistical variation test to decide if the value of the test sample could probably be part of the baseline group or if it is too different to be probably the case. The tool provides two different methods to make this decision: Standard Deviation Test and Inter-Quartile Range Test.
- Standard deviation. The sample is said to be unstable if its dispersion value is more than the mean plus three times the standard deviation.
- Interquartile range. The Inter-Quartile Range (IQR) is calculated by finding the first and third quartiles (Q1 and Q3) and subtracting them (IQR = Q3-Q1). The sample is said to be unstable if its dispersion value is more than Q3 + 1.5 * IQR. Note: remember that the coverage ratio metric is inversely correlated with the dispersion and therefore the signals must be inverted. For the standard deviation test, the sample is unstable if the coverage ratio is less than the mean minus three times the standard deviation. For the inter-quartile range test, the sample is unstable if the coverage ratio is less than Q1 - 1.5 * IQR.
- MSI status detection. Given the stability status of each individual locus of a test sample, the MSI status is detected by calculating the proportion of locus that are higher than a predefined threshold. There are two thresholds: one for low instability (MSI-L) and one for high instability (MSI-H). When calculating the proportion of unstable loci, only valid loci are taken in account and a minimum of 50% of the loci must be valid to make a call. If this is not the case, the status is set to "Not Available" (N/A).
- Maximum percentage of unstable loci for MSS, set by default at 15%
- Minimum percentage of unstable loci for MSI-H, set by default at 40%
The tool can output the following files: a MSI loci track (can be added to the track list produced by the TMB workflow by the user), a MSI status report and a Baseline cross-validation report.
The MSI status of the test sample is then presented in the form of a report for the user. The output report contains both combined and per loci information on stability or instability and other descriptive statistics related to the selected detection and test method. Coverage values are expressed in read coverage. Read Count refers to reads that have both delimiters and have been used for the calculation of the status. Coverage ratio allows assessment of the quality of the sequencing of the MSI loci: when few reads are represented to span the loci, it can either be because the loci in the sample is highly unstable thus creating longer reads not captured by spanning reads. This is most likely if the coverage is high. It can also be because the sequencing depth is to low to detect enough reads spanning the region, but in this case the coverage should be low.
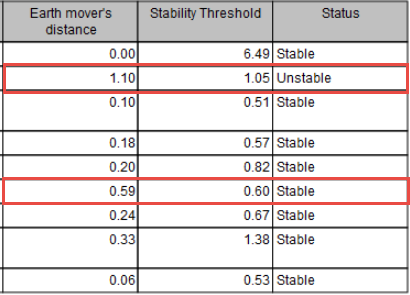
When MSI status are calculated using "Earth Mover's Distance", the report will display values for this calculation. If they are too close to the "Stability Threshold", the stability detection of the threshold may not be accurate (as is the case for 2 different samples highlighted in figure 3.29).

Figure 3.29: Report showing that two different samples may have been falsely detected as Unstable or Stable.
When the "Create baseline cross-validation report" option is selected, the "Detect MSI Status" tool will generate a cross-validation report in the form of a table where the MSI status is presented for each sample in the baseline sample set. The baseline cross-validation analysis is a procedure to verify whether the samples used for the creation of the baseline are suitable for such task. In this procedure, the MSI status of each sample from the baseline sample set is tested against a baseline created using all other samples of the set. Ideally, it is expected that all samples will be detected as stable (MSS) with a very low proportion of unstable loci. If this is not the case, the user may decide to remove one or more samples from the baseline sample set in case of doubt about the real status of the sample. Note that the cross-validation analysis is dependent on the parameters used for detection (exactly as for a test sample) and therefore each cross-validation is only valid for the selected set of parameter values used in the cross-validation run.
