De Novo Assemble PacBio Reads report
In the last dialog of the de novo assembly, you can choose to create a report of the results (see figure 14.7).
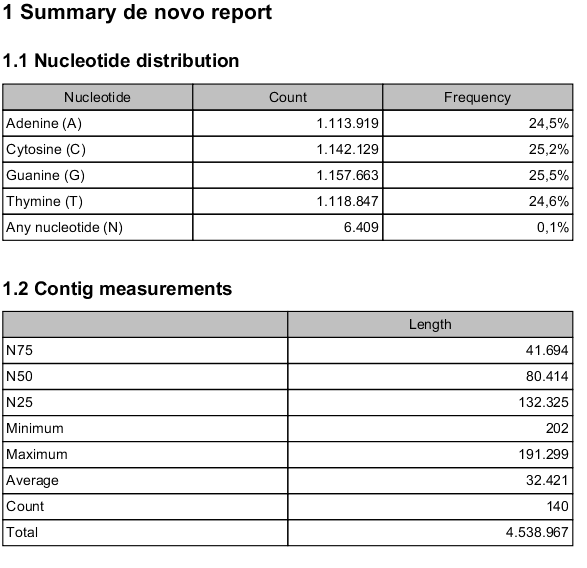
Figure 14.7: A de novo assembly report is useful for evaluating the quality of an assembly.
The report contains the following information:
- Nucleotide distribution:
- Fraction of the assembly covered by each nucleotide A, C, G and T.
- Contig measurements:
- This section includes statistics about
the number and lengths of contigs.
- Count:
- The total number of contigs.
- Total:
- The total number of bases in the result. This can be used for comparison with the estimated genome size to evaluate how much of the genome sequence is included in the assembly.
- N50, N75 and N90:
- The N50 contig set is calculated by summarizing the lengths of the longest contigs until you reach 50% of the total contig length. The minimum contig length in this set is the N50 value of a de novo assembly. The N75 and N90 values are computed in a similar fashion.
- Minimum, maximum and average:
- This refers to the contig lengths.
- Contig length distribution:
- A graph showing the number of contigs of different lengths.
- Accumulated contig lengths:
- This shows the summarized contig length on the y axis and the number of contigs on the x axis, with the biggest contigs ranked first. This answers the question: how many contigs are needed to cover e.g. half of the genome.