How to use the Collect Paired Read Statistics tool
The output for the Collect Paired Read Statistics tool is the paired statistics table shown in figure 8.3.
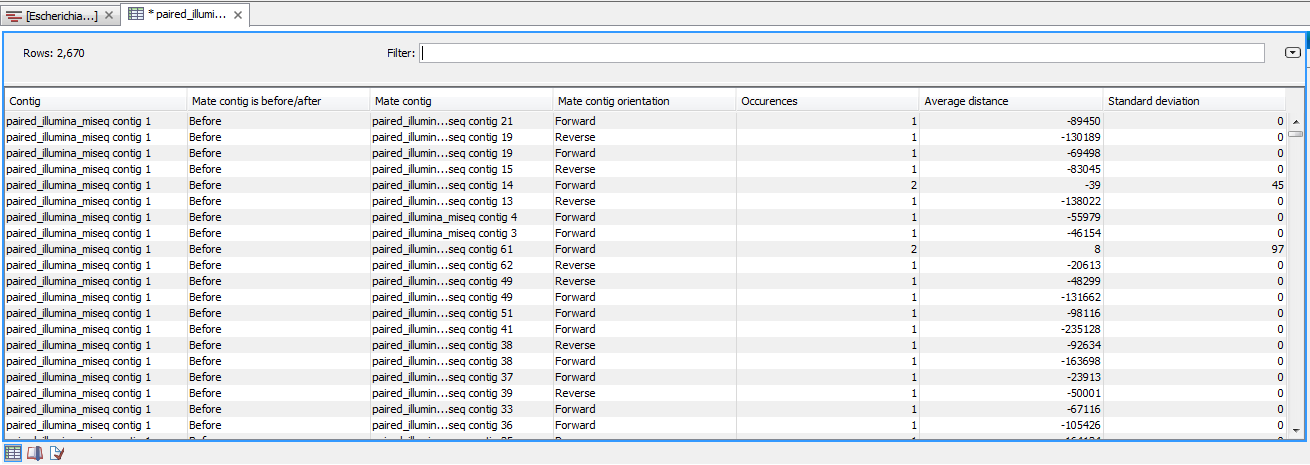
Figure 8.3: Paired read statistics table.
The table lists:
- Contig. The name of the first contig in the contig pair that shares paired reads.
- Mate Contig is Before/After. The localization of the mate contig relative to the first contig.
- Mate Contig. The name of the mate contig in the contig pair that shares paired reads.
- Mate Contig Orientation. Orientation of mate contig. The first contig is always in forward direction.
- Ocurrences. The number of paired reads shared by the two contigs.
- Average Distance. The average distance between the two contigs. A negative number indicates the size of an overlap
- Standard Deviation. The standard deviation of the average distance.
The table can be used to identify contigs that potentially can be joined or at least positioned relative to one another. Misassemblies may also be detected in cases with several shared reads, a large overlap (indicated with a large negative distance), and a small standard deviation.
One way to start using the table is to look at the contigs with most shared reads by clicking twice on the "Occurrence" column to sort after the most abundant paired reads. Entries with only few occurrences can be ignored or discarded by creating a filter that hides the least frequent entries. When potentially interesting contigs have been identified, this information can be used to edit the contigs. This can be done in different ways. If a reference sequence is available, the Align Contigs tool can be used to join or split contigs.
Splitting of contigs can also be performed directly on read mappings or de novo assembled data. Hence, no golden standard exist for how to process the data following detection of paired reads, as it will depend on whether a reference sequence is available or not, and on the type of problem to be solved. Additionally, the Collect Paired Read Statistics tool can be used together with the Align Contigs tool to see whether they support the same conclusions. An example of this is shown in figure 8.4.
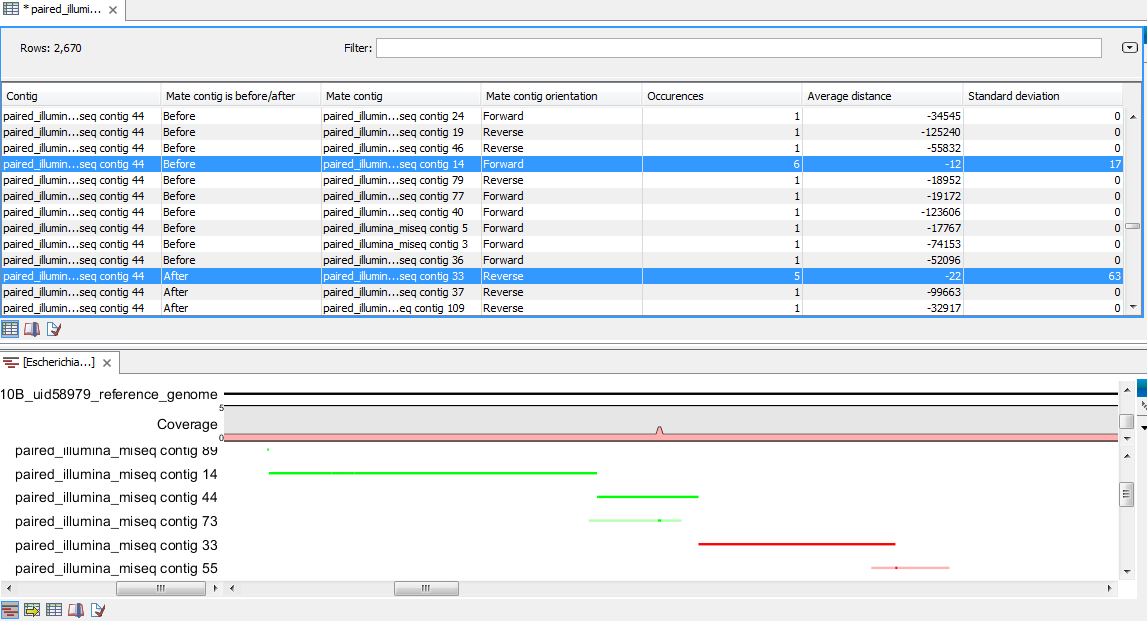
Figure 8.4: Paired read statistics table and contigs aligned to a reference in the Align Contigs tool. This shows that both tools agree on how "contig 14" and "contig 33" are positioned before and after "contig 44".