The report
In addition to the estimated error rates of the different types of errors shown in figure 21.63, the report contains information on the total error rates for each quality score as well as a distribution of the qualities of the individual bases in the reads in the read mapping, at the sites that were examined for variants (see figure 21.73).
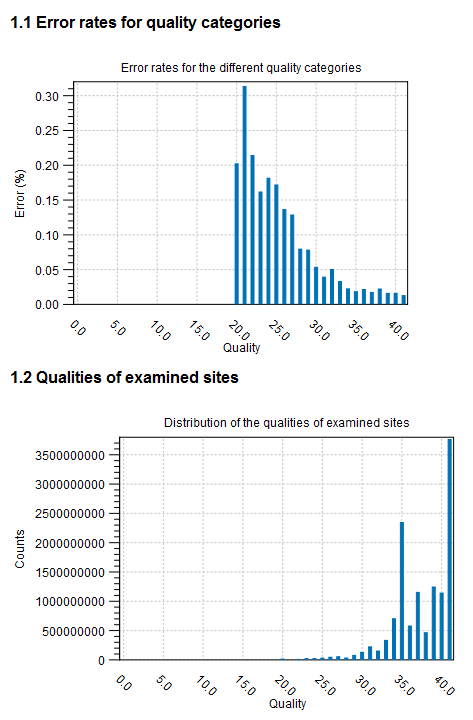
Figure 21.73: Part of the contents of the report on the variant calling.