Identify Candidate Variants and Genes from Tumor Normal Pair
The Identify Candidate Variants and Genes from Tumor Normal Pair tool identifies somatic variants and differentially expressed genes in a tumor normal pair. One tumor normal pair can be compared at the time. If you would like to compare more than one pair you must repeat the analysis with the next tumor normal pair.
To run the ready-to-use workflow:
Toolbox | Ready-to-Use Workflows | Whole Transcriptome Sequencing (![]() ) | (Human (
) | (Human (![]() ), Mouse (
), Mouse (![]() ) or Rat (
) or Rat (![]() )) | Identify Candidate Variants and Genes from Tumor Normal Pair (
)) | Identify Candidate Variants and Genes from Tumor Normal Pair (![]() )
)
- Double-click on the Identify Candidate Variants and Genes from Tumor Normal Pair tool to start the analysis. If you are connected to a server, you will first be asked where you would like to run the analysis.
- Specify the RNA-seq reads from the normal sample. The panel in the left side of the wizard shows the kind of input that should be provided (figure 16.16). Select by double-clicking on the reads file name or clicking once on the file and then clicking on the arrow pointing to the right side in the middle of the wizard. Click on the button labeled Next.
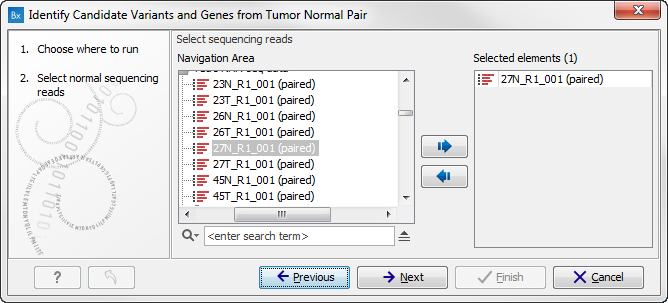
Figure 16.16: Select the RNA-seq reads from the normal sample. - In the next step you will be asked to select the RNA-seq reads from the tumor sample (see figure 16.17).
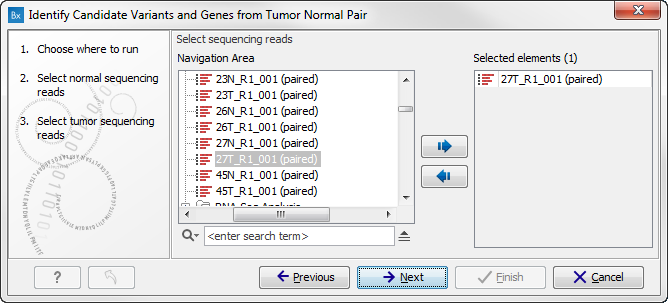
Figure 16.17: Select the RNA-seq reads from the tumor sample. - In the next wizard step (figure 16.18) you can adjust the settings for the Create fold change track tool. This tool calculates for each transcript or gene the ratio between the expression values in the normal and the tumor sample. It becomes then possible to filter on fold changes and expression values, which makes it easy to identify differentially expressed transcripts or genes. The parameters that can be adjusted in this wizard step are described in detail in the Biomedical Genomics Workbench user manual (see http://clcsupport.com/biomedicalgenomicsworkbench/current/index.php?manual=Create_fold_change_track.html).
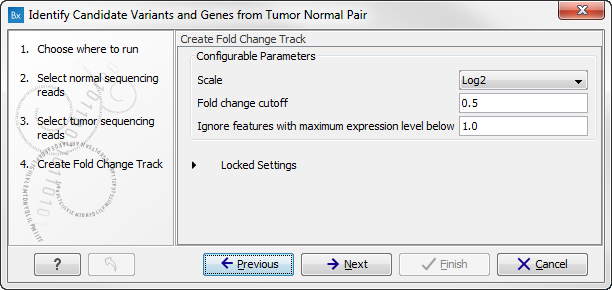
Figure 16.18: Specify the parameters for variant calling. - Specify in the next 2 windows a target region for the analysis of the Normal sample with the Indels and Structural Variants tool first for the Normal sample, followed by the Tumor sample (figure 16.19).
The targeted region file is a file that specifies which regions have been sequenced. This file is something that you must provide yourself, as this file depends on the technology used for sequencing. You can obtain the targeted regions file from the vendor of your targeted sequencing reagents.
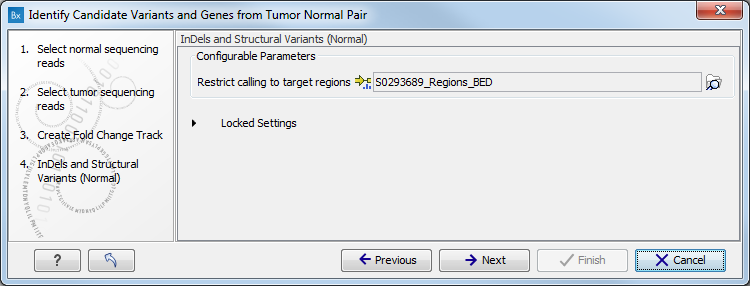
Figure 16.19: Specify the target region for the Indels and Structural Variants tool. - Set the parameters for the Low Frequency Variant Detection step (see figure 16.20). For a description of the different parameters that can be adjusted in the variant detection step, see http://clcsupport.com/biomedicalgenomicsworkbench/current/index.php?manual=Low_Frequency_Variant_Detection.html.
If you click on "Locked Settings", you will be able to see all parameters used for variant detection in the ready-to-use workflow.
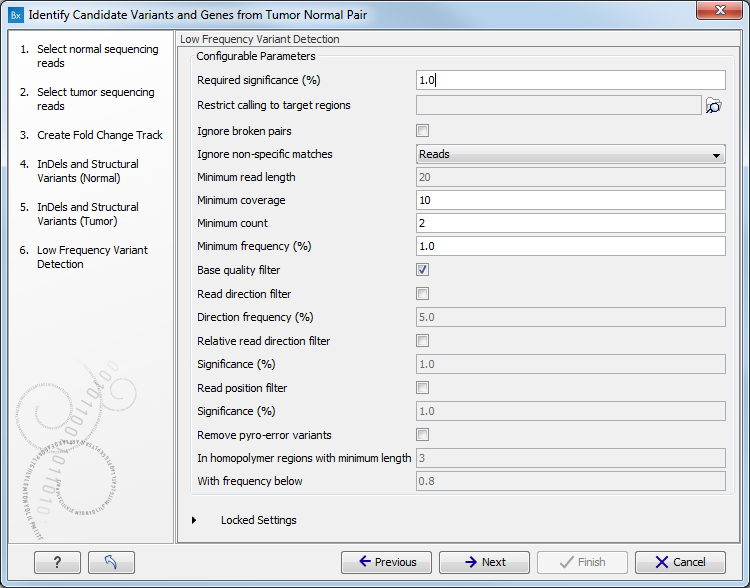
Figure 16.20: Specify the parameters for variant calling. - The next wizard step (figure 16.21) concerns removal of germline variants. You are asked to supply the number of reads in the control data set that should support the variant allele in order to include it as a match. All the variants where at least this number of control reads show the particular allele will be filtered away in the result track.
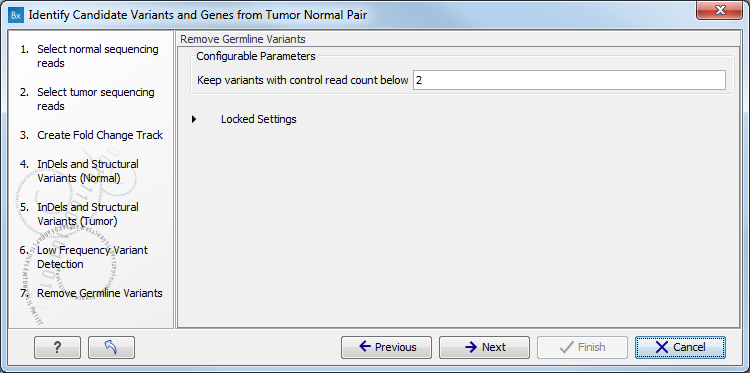
Figure 16.21: Specify the number of reads to use as cutoff for removal of germline variants. - Click on the button labeled Next to go to the last wizard step (shown in figure 16.22).
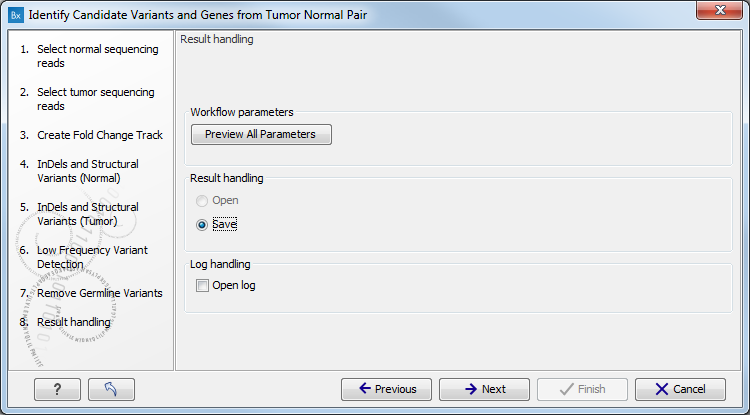
Figure 16.22: Check the selected parametes by pressing "Preview All Parameters".Pressing the button Preview All Parameters allows you to preview all parameters. At this step you can only view the parameters, it is not possible to make any changes (see figure 16.23). Choose to save the results and click on the button labeled Finish.
Figure 16.23: Preview all parameters. At this step it is not possible to introduce any changes, it is only possible to view the settings.
Thirteen types of output are generated:
- Gene Expression Normal and Gene Expression Tumor (
 ) A track showing gene expression annotations. Hold the mouse over or right-clicking on the track. A tooltip will appear with information about e.g. gene name and gene expression values.
- Transcript Expression Normal and Transcript Expression Tumor () A track showing transcript expression annotations. Hold the mouse over or right-clicking on the track. A tooltip will appear with information about e.g. gene name and transcript expression values.
- RNA-Seq Mapping Report Normal and RNA-Seq Mapping Report Tumor (
 ) This report contains information about the reads, reference, transcripts, and statistics. This is explained in more detail in the Biomedical Genomics Workbench reference manual in section RNA-Seq report (http://clcsupport.com/biomedicalgenomicsworkbench/current/index.php?manual=RNA_Seq_report.html).
- Read Mapping Normal and Read Mapping Tumor (
 ) The mapped RNA-seq reads. The RNA-seq reads are shown in different colors depending on their orientation, whether they are single reads or paired reads, and whether they map unambiguously. For the color codes please see the description
in (see http://www.clcsupport.com/biomedicalgenomicsworkbench/current/index.php?manual=View_settings_in_Side_Panel.html).
) The mapped RNA-seq reads. The RNA-seq reads are shown in different colors depending on their orientation, whether they are single reads or paired reads, and whether they map unambiguously. For the color codes please see the description
in (see http://www.clcsupport.com/biomedicalgenomicsworkbench/current/index.php?manual=View_settings_in_Side_Panel.html).
- Differentially Expressed Genes file (
 ) A track showing the differentially expressed genes. The table view provides information about fold change, difference in expression, the maximum expression (observed in either the case or the control), the expression in the case, and the expression in the control.
- Variant Calling Report Tumor () Report showing error rates for quality categories, quality of examined sites, and estimated frequencies of actual to called bases for different quality score ranges.
- Annotated Somatic Variants with Expression Values (
 ) A variant track showing the somatic variants. When mousing over a variant, a tooltip will appear with information about the variant.
- Amino Acid Track
- Genome Browser View RNA-Seq Tumor_Normal Comparison (
 ) A collection of tracks presented together. Shows the annotated variants track together with the human reference sequence, genes, transcripts, coding regions, and variants detected in ClinVar and dbSNP (see figure 16.24).
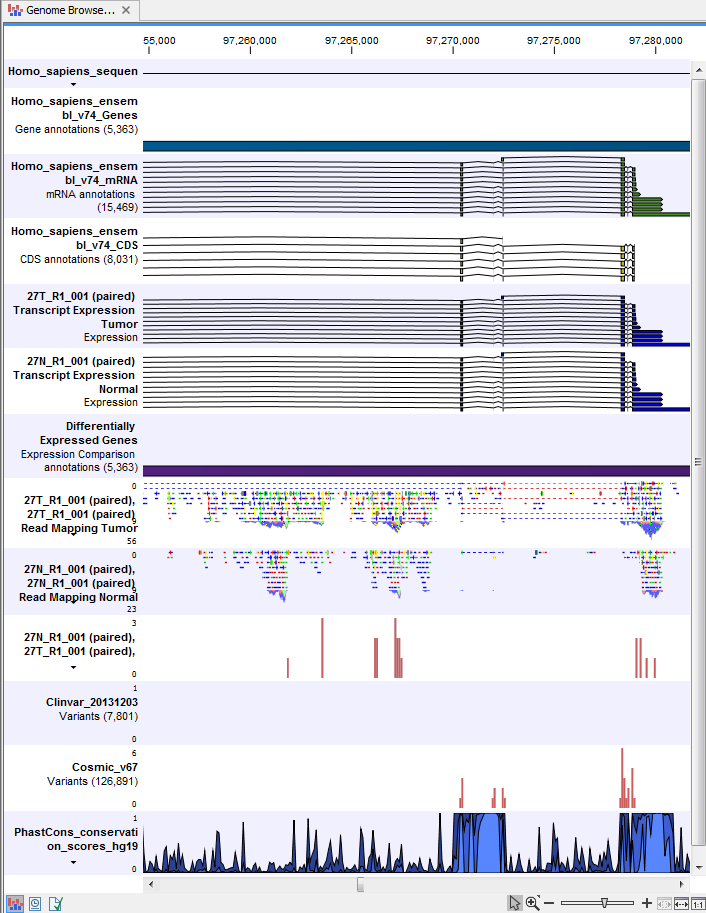
Figure 16.24: The Genome Browser View is a collection of a number of tracks. The Genome Browser View makes it easy to compare the different tracks. Each track kan be opened individually by double-clicking on the track name in the left side of the View Area.