Qc Sequencing Report Content
The report comes in two different flavors: a supplementary report consisting of tables representing all the values that are calculated, and a main summary reports where the tables are visualized in plots (see an example in figure 19.10). Both reports can be exported as pdf files or Excel spread sheets.
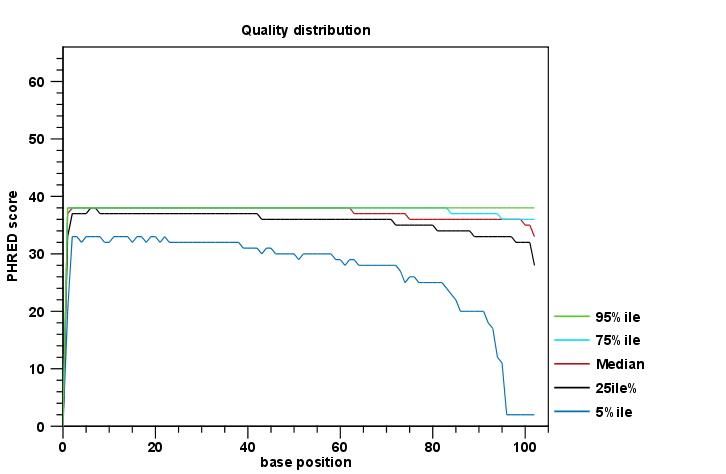
Figure 19.10: An example of a plot from the graphical report, showing the quality values per base position.
The Summary table provides information regarding the creation date, the author, the software used, the number of data sets the report is based upon, as well as data name and content in terms of read number and total number of nucleotides. The report is then divided in per-sequence and per-base analyses. In the per-sequence analyses, some characteristic (a single value) is assessed for each sequence and then contributes to the overall assessment. In per-base assessments each base position is examined and counted independently. In both sections, the first items assess the most simple characteristics that are supported by all sequencing technologies while the quality analyses examine quality scores reported from technology-dependent base callers. Please note that the NGS import tools of the CLC Genomics Workbench and CLC Genomics Server convert quality scores to PHRED-scale, regardless of the data source.
Subsections