Identify highly mutated gene groups and pathways
This tool can be used to investigate candidate variants or better their corresponding altered genes for a common functional role. For example if you would like to compare different cancer patients to check whether e.g. the same pathways are affected in different individuals, you can use this tool. For this, you need a GO association file, which includes gene names and associated Gene Ontology terms. A GO association file with the top-level GO terms annotated (GO slim) is provided with the Biomedical Genomics Workbench and can be downloaded using the Data Management (![]() ) function found in the top right corner of the Workbench (see Download and configure reference data).
) function found in the top right corner of the Workbench (see Download and configure reference data).
To run the analysis go to the toolbox:
Toolbox | Identify Candidate Genes (![]() ) | Identify highly mutated gene groups and pathways (
) | Identify highly mutated gene groups and pathways (![]() )
)
When you run the Identify highly mutated gene groups and pathways analysis, you have to specify both the annotation association file, a gene track, and finally which ontology (cellular component, biological process or molecular function) you would like to test for (see figure 27.3).
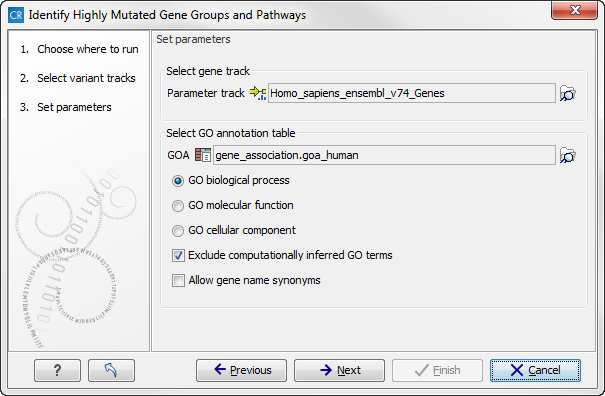
Figure 27.3: Select gene track, GO annotation table, and ontology.
The analysis starts by associating all of the variants from the input variant file with genes in the gene track, based on overlap with the gene annotations. A variant track can be created with the Biomedical Genomics Workbench (variant callers or InDels and Structural Variation.
Next, the Workbench tries to match gene names from the gene (annotation) track with the gene names in the GO association file. Please be aware that the same gene name definition should be used in both files.
Based on this, the Workbench finds GO terms that are over-represented in the list. A hypergeometric test is used to identify over-represented GO terms by testing whether some of the GO terms are over-represented in a given gene set, compared to a randomly selected set of genes.
The result is a table with GO terms and the calculated p-value for the candidate variants, and a new variant file with annotated GO terms and the corresponding p-value (see figure 27.4). The p-value is the probability of obtaining a test statistic at least as extreme as the one that was actually observed, or in other words how significant (trustworthy) a result is. In case of a small p-value the probability of achieving the same result by chance with the same test statistic is very small.
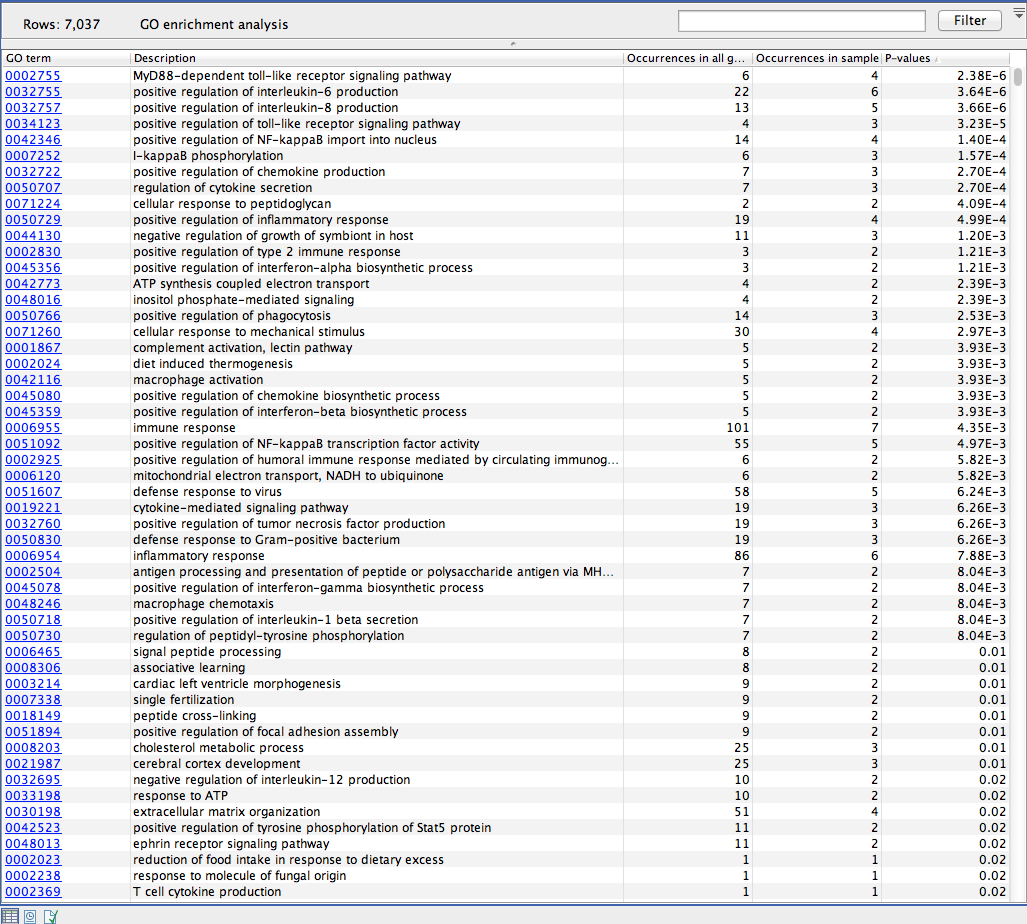
Figure 27.4: The results of the analysis.