Viewing the result of k-means/medoids clustering
The result of the clustering is a number of graphs. The number depends on the number of partitions chosen (figure 28.92) - there is one graph per cluster. Using drag and drop as explained in Arrange views, you can arrange the views to see more than one graph at the time.Figure 28.94 shows an example where four clusters have been arranged side-by-side.
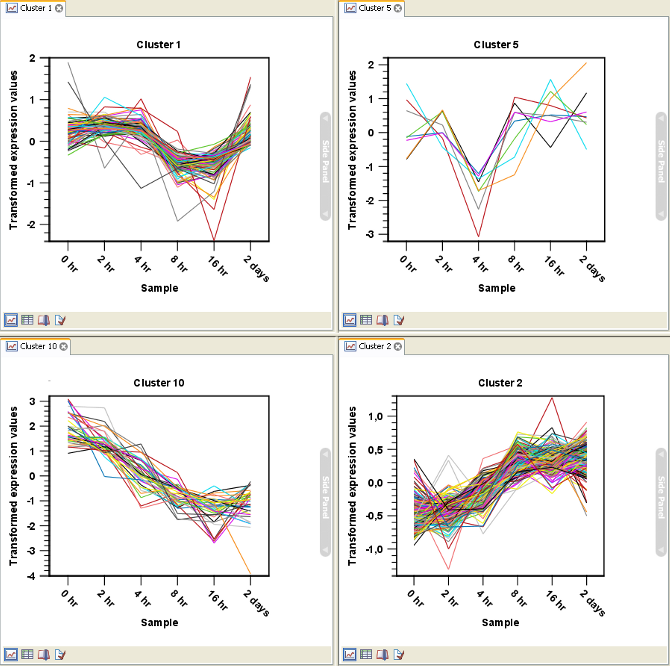
Figure 28.94: Four clusters created by k-means/medoids clustering.
The samples used are from a time-series experiment, and you can see that the expression levels for each cluster have a distinct pattern. The two clusters at the bottom have falling and rising expression levels, respectively, and the two clusters at the top both fall at the beginning but then rise again (the one to the right starts to rise earlier that the other one).
Having inspected the graphs, you may wish to take a closer look at the features represented in each cluster. In the experiment table, the clustering has added an extra column with the name of the cluster that the feature belongs to. In this way you can filter the table to see only features from a specific cluster. This also means that you can select the feature of this cluster in a volcano or scatter plot as described in Cross-view selections.