Table of restriction sites
The restriction map can be shown as a table of restriction sites (see figure 30.45).
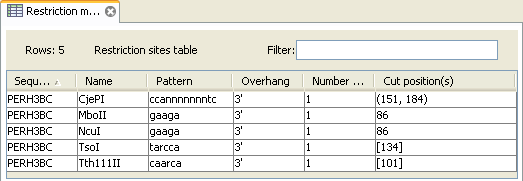
Figure 30.45: The result of the restriction analysis shown as annotations.
Each row in the table represents a restriction enzyme. The following information is available for each enzyme:
- Sequence. The name of the sequence which is relevant if you have performed restriction map analysis on more than one sequence.
- Name. The name of the enzyme.
- Pattern. The recognition sequence of the enzyme.
- Overhang. The overhang produced by cutting with the enzyme (3', 5' or Blunt).
- Number of cut sites.
- Cut position(s). The position of each cut.
- , If the enzyme cuts more than once, the positions are separated by commas.
- [] If the enzyme's recognition sequence is on the negative strand, the cut position is put in brackets (as the enzyme TsoI in figure 30.45 whose cut position is [134]).
- () Some enzymes cut the sequence twice for each recognition site, and in this case the two cut positions are surrounded by parentheses.