Result of gene set enrichment analysis
The result of performing gene set enrichment analysis using GO biological process is shown in figure 28.99.
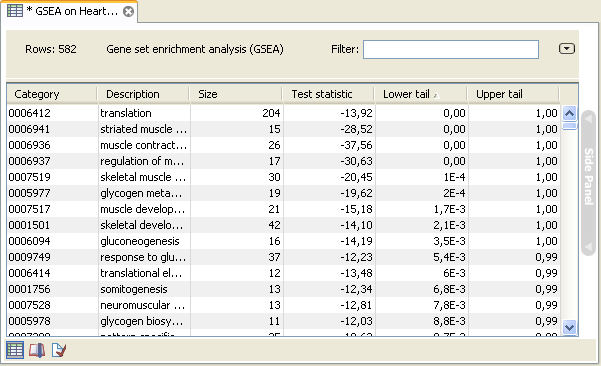
Figure 28.99: The result of gene set enrichment analysis on GO biological process.
The table shows the following information:
- Category. This is the identifier for the category.
- Description. This is the description belonging to the category. Both of these are simply extracted from the annotations.
- Size. The number of features with this category. (Note that this is after removal of duplicates).
- Test statistic. This is the GSEA test statistic.
- Lower tail. This is the mass in the permutation based p-value distribution below the value of the test statistic.
- Upper tail. This is the mass in the permutation based p-value distribution above the value of the test statistic.
A small lower (or upper) tail p-value for an annotation category is an indication that features in this category viewed as a whole are perturbed among the groups in the experiment considered.