Visualizing RNA-Seq read tracks for the experiment
When working with RNA-Seq data, the experiment can be used to browse the read mappings to investigate how the reads supporting each sample are mapped. This is done by creating a track list:
File | New | Genome Browser View (![]() )
)
Select the mapping and expression tracks of the samples you wish to visualize together and select any annotation tracks (e.g. gene and mRNA) to be included for visualization Finish.
Once the track list is shown, create a split view or drag the tab of the view on to a second screen (if you have two screens). Clicking a row in the table makes the track list view jump to that location, allowing for quick inspection of interesting parts of the RNA-Seq read mapping (see an example in figure 28.60. Note that the Zoom to selection (![]() ) button can be used to adjust the zoom level to fit the region selection.
) button can be used to adjust the zoom level to fit the region selection.
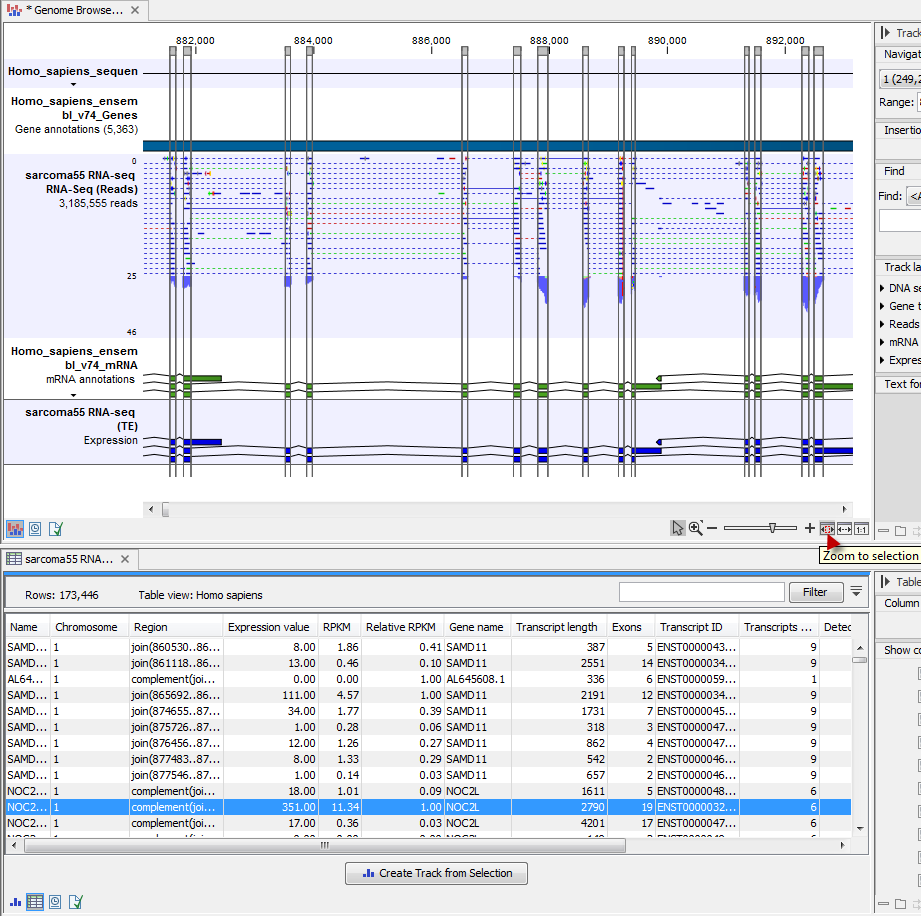
Figure 28.60: RNA-Seq results shown in a split view with an experiment table at the bottom and a track list with read mappings of several samples at the top.
Please note that at least one of the expression tracks used in the experiment have to be included in the track list in order for the link between the two to work.