Gene set enrichment analysis
When carrying out a hypergeometric test on annotations you typically compare the annotations of the genes in a subset containing 'the significantly differentially expressed genes' to those of the total set of genes in the experiment. Which, and how many, genes are included in the subset is somewhat arbitrary - using a larger or smaller p-value cut-off will result in including more or less. Also, the magnitudes of differential expression of the genes is not considered.
The Gene Set Enrichment Analysis (GSEA) does NOT take a sublist of differentially expressed genes and compare it to the full list - it takes a single gene list (a single experiment). The idea behind GSEA is to consider a measure of association between the genes and phenotype of interest (e.g. test statistic for differential expression) and rank the genes according to this measure of association. A test is then carried out for each annotation category, for whether the ranks of the genes in the category are evenly spread throughout the ranked list, or tend to occur at the top or bottom of the list.
The GSEA test implemented here is that of [Tian et al., 2005]. The test implicitly calculates and uses a standard t-test statistic for two-group experiments, and ANOVA statistic for multiple group experiments for each feature, as measures of association. For each category, the test statistics for the features in than category are summed and a category based test statistic is calculated as this sum divided by the square root of the number of features in the category. Note that if a feature has the value NaN in one of the samples, the t-test statistic for the feature will be NaN. Consequently, the combined statistic for each of the categories in which the feature is included will be NaN. Thus, it is advisable to filter out any feature that has a NaN value before applying GSEA.
The p-values for the GSEA test statistics are calculated by permutation: The original test statistics for the features are permuted and new test statistics are calculated for each category, based on the permuted feature test statistics. This is done the number of times specified by the user in the wizard. For each category, the lower and upper tail probabilities are calculated by comparing the original category test statistics to the distribution of the permutation-based test statistics for that category. The lower and higher tail probabilities are the number of these that are lower and higher, respectively, than the observed value, divided by the number of permutations.
As the p-values are based on permutations you may some times see results where category x's test statistic is lower than that of category y and the categories are of equal size, but where the lower tail probability of category x is higher than that of category y. This is due to imprecision in the estimations of the tail probabilities from the permutations. The higher the number of permutations, the more stable the estimation.
You may run a GSEA on a full experiment, or on a sub-experiment where you have filtered away features that you think are un-informative and represent only noise. Typically you will remove features that are constant across samples (those for which the value in the 'Range' column is zero' -- these will have a t-test statistic of zero) and/or those for which the inter-quantile range is small. As the GSEA algorithm calculates and ranks genes on p-values from a test of differential expression, it will generally not make sense to filter the experiment on p-values produced in an analysis if differential expression, prior to running GSEA on it.
Toolbox | Transcriptomics Analysis (![]() )| Annotation Test | Gene Set Enrichment Analysis (GSEA) (
)| Annotation Test | Gene Set Enrichment Analysis (GSEA) (![]() )
)
Select an experiment and click Next.
Click Next. This will display the dialog shown in figure 28.97.
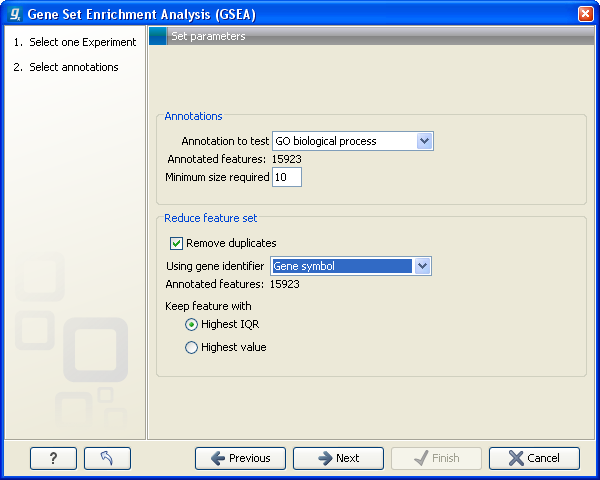
Figure 28.97: Gene set enrichment analysis on GO biological process
At the top, you select which annotation to use for testing. You can select from all the annotations available on the experiment, but it is of course only a few that are biologically relevant. Once you have selected an annotation, you will see the number of features carrying this annotation below.
In addition, you can set a filter: Minimum size required. Only categories with more genes (i.e. features) than the specified number will be considered. Excluding categories with small numbers of genes may lead to more robust results.
Annotations are typically given at the gene level. Often a gene is represented by more than one feature in an experiment. If this is not taken into account it may lead to a biased result. The standard way to deal with this is to reduce the set of features considered, so that each gene is represented only once. Check the Remove duplicates check box to reduce the feature set, and you can choose how you want this to be done:
- Using gene identifier.
- Keep feature with:
- Highest IQR. The feature with the highest interquartile range (IQR) is kept.
- Highest value. The feature with the highest expression value is kept.
Clicking Next will display the dialog shown in figure 28.98.
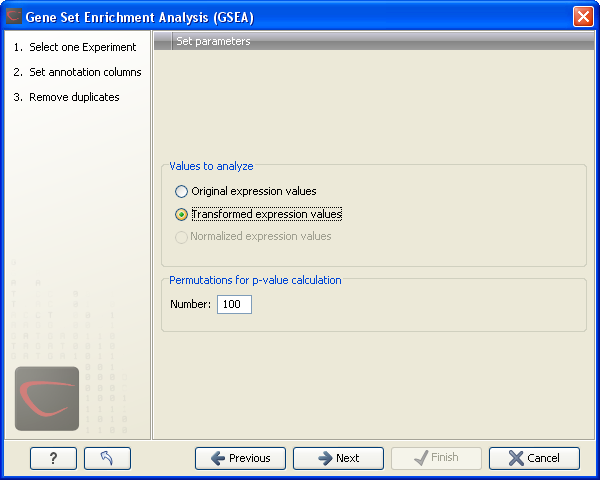
Figure 28.98: Gene set enrichment analsysis parameters.
At the top, you can select which values to analyze (see Selecting transformed and normalized values for analysis).
Below, you can set the Permutations for p-value calculation. For the GSEA test a p-value is calculated by permutation: p permuted data sets are generated, each consisting of the original features, but with the test statistics permuted. The GSEA test is run on each of the permuted data sets. The test statistic is calculated on the original data, and the resulting value is compared to the distribution of the values obtained for the permuted data sets. The permutation based p-value is the number of permutation based test statistics above (or below) the value of the test statistic for the original data, divided by the number of permuted data sets. For reliable permutation-based p-value calculation a large number of permutations is required (100 is the default).
Click Next if you wish to adjust how to handle the results. If not, click Finish.
Subsections