Genome browser tools
This chapter explains how to visualize tracks, how to retrieve reference data and finally how to perform generic comparisons between tracks.
The genome browser is the graphical interface where tracks can be presented alone or together with other tracks. Tracks are the fundamental building blocks for data analysis in the Biomedical Genomics Workbench and provide a unified framework for the visualization, comparison and analysis of genome-scale studies.
In tracks, all information is tied to genomic positions. A central coordinate-system is provided by a reference genome, which allows that different types of data or results for different samples can be seen and analyzed together.
Different types of data are represented in different types of tracks, and each type of track has its own particular editors. An example of a paired-end mapping read-track displaying reads and coverage is shown in figure 18.1.
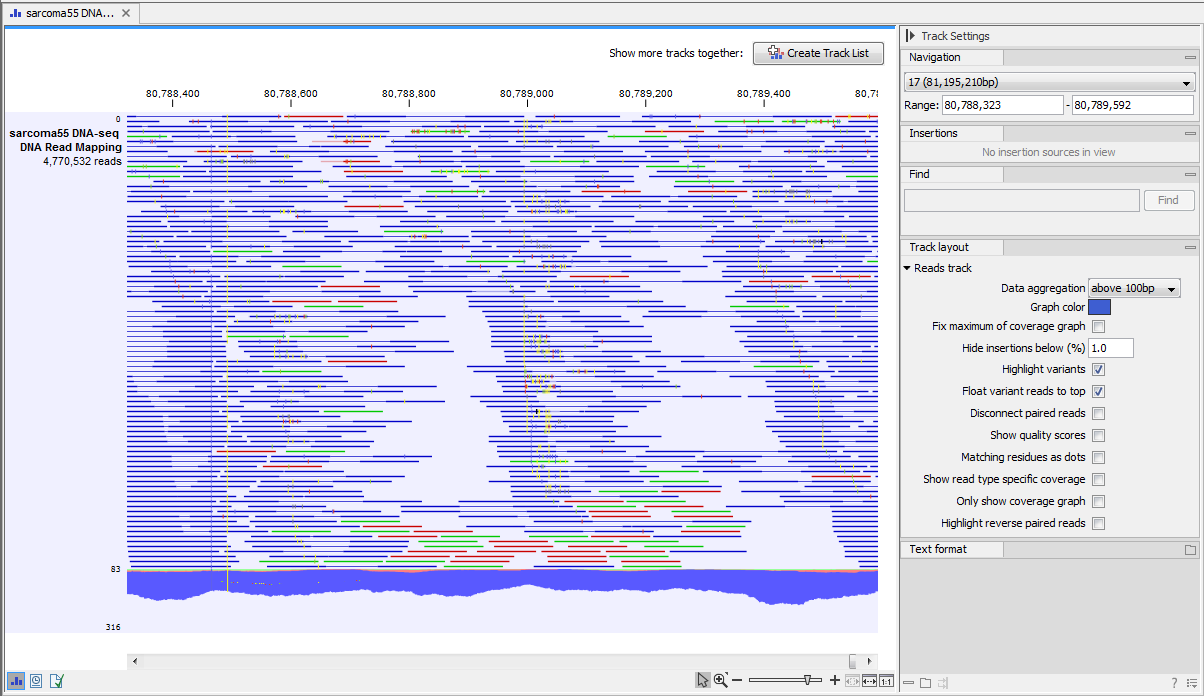
Figure 18.1: A paired-end mapping read-track opened, displaying reads and coverage. On the top right, the button for creating a Track List is visible. On the right is the SidePanel.
The different track types in the Biomedical Genomics Workbench are:
- A sequence (
 )
) - This is the track type that is used for holding the reference genome. The sequence track contains the single reference sequences of the genome (e.g. the chromosomes or the consensus sequences of de novo assembled contigs).
- A reads track (
 )
) - This is the track type that is used for holding a read mapping e.g. as produced by the Map Reads to Reference or Local Realignment tools. The reads track contains all the reads that have been mapped at their mapped positions, and you can zoom in all the way to base resolution.
- A variant track (
 )
) - A variant track is a particular kind of track that is used to store features that fulfill the requirements for being a variant. A particular requirement for being a variant is that it refers to a particular region of the reference, and it is possible to describe exactly how the sample "Allele" sequence looks in this region, as compared to what the "reference allele" sequence looks like in this region.
Variants may be of type SNV, MNV, replacement, insertion or deletion. A variant track may be produced either by running a Variant detection analysis (e.g using the Probabilistic or Quality-based variant callers or by importing a variant format file (such as a "vcf" or a "gvf" file) or downloading it from a database (e.g. dbSNP).
The tool InDels and Structural Variants detects structural variants, including insertions, deletions, inversions, translocations and tandem duplications. It will produce a variant track, which will contain some insertions and deletions (the "InDel" track). However, the tool will also detect some insertions for which the "Allele" sequence is not fully, but only partially, known. These insertions do not fulfill the requirements of being a variant and therefore cannot be put in the variant track. Instead they are put in the "SV track", along with the inversions and translocations. The "SV" track is an "annotation" (or "feature") track, which is less strict and more flexible, in the requirements to the types of annotations (or features) that it can contain (see below).
- An annotation track (
 )
) - Each annotation track contains a certain type of annotations. Examples are gene or mRNA tracks, which contain gene, respectively mRNA, annotations, UTR tracks, conservation score tracks and target region tracks. They may be obtained either by importing (Import Tracks or downloading them into the Workbench (e.g from a .bed, .gtf or .gff file or a database, such as ENSEMBL). Also, many of the tools in the Biomedical Genomics Workbench will output annotation tracks. Examples are the Indels and Structural Variants tool, which will put the detected structural variants (that do not fulfill the requirements for being of type "variant") in an annotation track, or the ChIP-seq detection tool which will put the detected "peaks" into a "peak" annotation track.
- A coverage graph (
 )
) - The coverage graph track is calculated from a reds track and contains a graphical display of the coverage at each position in the reference.
- An expression track (
 )
) - The RNA-seq algorithm produces expression tracks; one for genes and one for transcripts. These are tracks that have an annotation for each gene, respectively transcript, and an expression value associated to that annotation.
An example of the different types of tracks is given in figure 18.2.
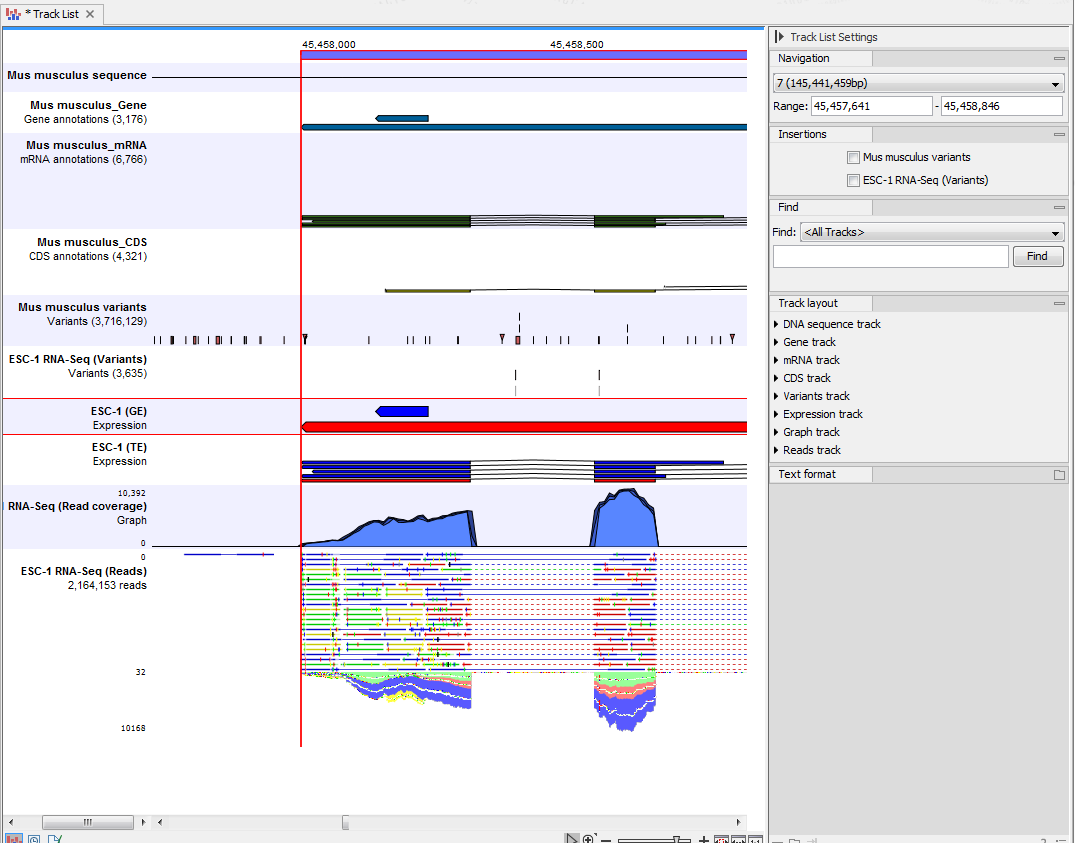
Figure 18.2: A tracklist containing different types of tracks. From the top: a sequence track, three annotation tracks with gene, mRNA and CDS annotations respectively, two variant tracks, a gene-level (GE) and a transcript level (TE) expression track, a coverage track and a reads track.
Subsections