Detailed information mode
In this mode a very detailed account is given of the properties of all the available primers. When a region is chosen primer information will appear in groups of lines beneath it (see figure 32.5).
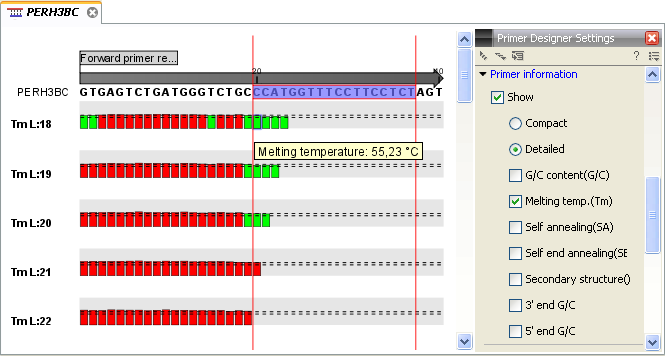
Figure 32.5: Detailed information mode
The number of information-line-groups reflects the chosen length interval for primers and probes. One group is shown for every possible primer length. Within each group, a line is shown for every primer property that is selected from the checkboxes in the primer information preference group. Primer properties are shown at each potential primer starting position and are of two types:
Properties with numerical values are represented by bar plots. A green bar represents the starting point of a primer that meets the set requirement and a red bar represents the starting point of a primer that fails to meet the set requirement:
- G/C content
- Melting temperature
- Self annealing score
- Self end annealing score
- Secondary structure score
Properties with Yes - No values. If a primer meets the set requirement a green circle will be shown at its starting position and if it fails to meet the requirement a red dot is shown at its starting position:
- C/G at 3' end
- C/G at 5' end
Common to both sorts of properties is that mouse clicking an information point (filled circle or bar) will cause the region covered by the associated primer to be selected on the sequence.