Monitoring analysis automation service
When the analysis automation service is running, a green status icon is displayed for each active automation configuration (see figure 3.2).

Figure 3.2: Analysis automation menu with running service
Next to the green icon is a status text listing how many analyses have been submitted for the given configuration since the latest restart of the CLC Genomics Server (or since the latest manual statistics reset, see Resetting submission statistics). While any of the submitted analyses are still being processed, the status text also lists the number of running analyses (see figure 3.3).

Figure 3.3: Analysis automation menu with running analyses
Failed analyses
If any of the submitted analyses for a configuration failed, or if something went wrong during the submission process, the status icon turns yellow, and the status text lists the number of failed jobs (see figure 3.4). The error causing the failure can be viewed by opening the job status dialog as described in Viewing job status and errors. Once the errors have been investigated they can be removed by resetting the submission statistics as described in Resetting submission statistics.

Figure 3.4: Analysis automation menu with failed analyses
Failed submitters
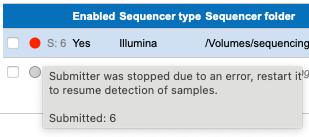
The analysis automation service starts a job submitter for each of the enabled automation configurations. If one of these submitters encounter an unrecoverable error during job submission, automation for the given configuration will be stopped and its status icon will turn red (see figure 3.5). To reactivate the configuration please either restart the analysis automation service, or disable+enable the configuration while the service is running by selecting the configuration and clicking the disable/enable buttons as described in Multi-configuration operations.
Subsections

