How to interpret fold-changes when the sample purity is not 100%
If your sample purity is less than 100%, it is necessary to take that into account when interpreting the fold-change values. Given a sample purity of
| fold-change in 100% pure sample |
(22.8) |
For example, if the sample purity is 40%, and you have observed a fold-change of 3, then the fold-change in the 100% pure sample would have been:
| fold-change in 100% pure sample |
(22.9) |
Figures 22.59 shows the `true' fold changes for different observed fold-changes at different sample purities. Figure 22.60 zooms in for low-level amplifications and deletions.
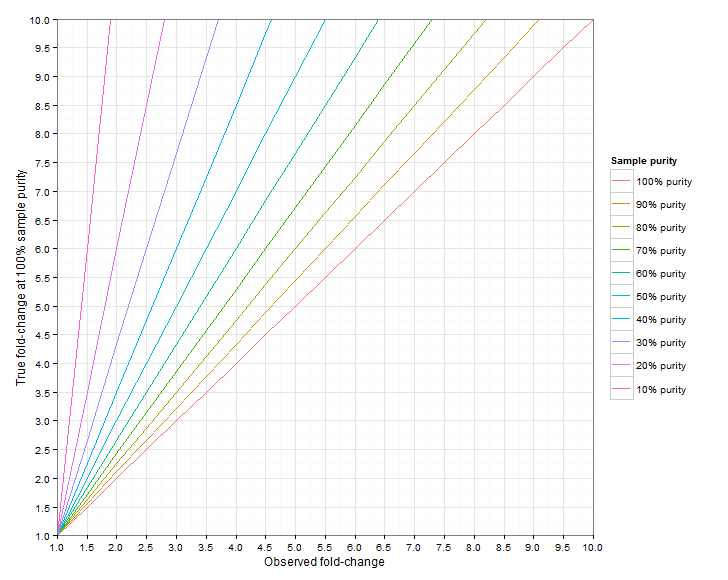
Figure 22.59: The true fold-change in the 100% pure sample, for different observed fold-changes, as a function of sample purity.
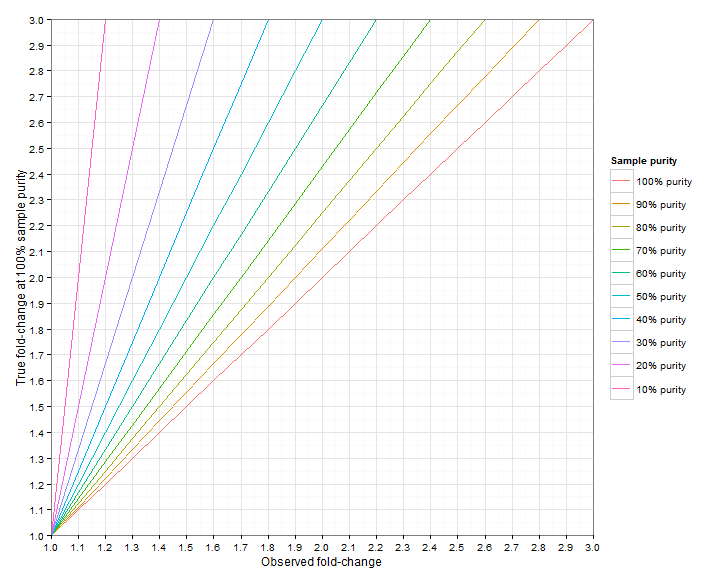
Figure 22.60: Low-level amplifications and deletions: the true fold-change in the 100% pure sample, for different observed fold-changes, as a function of sample purity.