Immune Repertoire Analysis
Using RNA-Seq data as input, the Immune Repertoire Analysis tool can be used to characterize either the T or B cell receptor repertoire.
The tool requires a reference data sequence list (![]() ) containing reference sequences for the V and J segments.
) containing reference sequences for the V and J segments.
Whether the tool identifies T or B cell receptors depends on the types of V and J segments present in the provided sequence list. The tool does not accept sequence lists containing reference sequences for both TCR and BCR.
|
Primers are often designed to target the C segment. This part of the read should be trimmed prior to the analysis. This can be done using the Trim Reads tool and a trim adapter list, see http://resources.qiagenbioinformatics.com/manuals/clcgenomicsworkbench/current/index.php?manual=Trim_Reads.html. Trim adapter lists are provided as part of the reference data set or imported for trimming at the 5'. For protocols where the C segment is at the 3' end of the read, a protocol-specific trim adapter list should be used instead, see Import Immune Reference Segments. |
The Reference Data Manager (see Reference Data Management) offers two QIAGEN set for this tool. Each set contains a sequences list for Immune Repertoire Analysis as well as a trim adapter list for trimming the reads prior to the analysis:
- QIAseq Immune Repertoire Analysis for analysis of TCR human data.
- QIAseq Immune Repertoire Analysis Mouse for analysis of TCR mouse data.
If reference data is needed for BCR or for a different species than those above, Import Immune Reference Segments can be used to import reference data, see Import Immune Reference Segments.
|
The tool assumes that one read spans both V and J in order to successfully recover the CDR3 region. It is therefore recommended to collapse overlapping paired-end reads using Merge Overlapping Pairs, see http://resources.qiagenbioinformatics.com/manuals/clcgenomicsworkbench/current/index.php?manual=Merge_Overlapping_Pairs.html. |
Identification of clonotypes
Clonotyping a read consists of identifying which V and J segments from the reference data are used and extracting the CDR3 region found between the conserved amino acids.
V segments are rather long (![]() bp), whereas J segments are relatively short (
bp), whereas J segments are relatively short (
![]() bp).
The identification of V and J segments is therefore performed using two different strategies.
bp).
The identification of V and J segments is therefore performed using two different strategies.
For V segments, the Map Reads to Reference tool is used internally. A read with multiple segments matches will provisionally have all these segments assigned and in a subsequent merging step, a read may be assigned a specific segment.
As J segments are short, a strategy similar to IMSEQ [Kuchenbecker et al., 2015] is used. First, a pairwise alignment with a 15 bp subsequence of the full segment called a Segment Core Fragment (SCF) is performed to find candidates for full pairwise alignments. If the pairwise alignment of an SCF to the read has a sufficiently small number of errors, it is nominated as a candidate. A full pairwise alignment is then made for all the segments corresponding to the candidate SCFs. If there is a sufficiently good match among the full alignments it will be assigned to the read.
Merging of clonotypes
After the initial identification of clonotypes, some clonotypes are merged to reduce false positives due to sequencing errors and resolve ambiguities, i.e. multiple assigned segments. Clonotype merging is performed in two steps.
The first step tries to resolve ambiguous segment assignments. Some of the reference V and J segments have a large degree of sequence identity, e.g. in mouse a recent duplication event has resulted in multiple paralogue TCR V segments with a sequence identity of more than 97%. If a sequencing read does not cover the regions where paralogue segments differ, the segment cannot be unambiguously identified. In these cases all possible V and/or J segments will be listed using a comma for separation of the different options. However, there might be reads with the same CDR3 nucleotide sequence where the segment can be uniquely determined. It is unlikely that two different clonotypes would share the same CDR3 and have almost identical V and J segments. We thus merge clonotypes with ambiguous segments into clonotypes with unambiguous segments provided they share CDR3 sequence and their V and J segments overlap.
The second merging step tries to correct sequencing errors in the CDR3 region, where a highly expressed clonotype would result in multiple clonotypes being reported if not corrected for. In this step, clonotypes are merged if their V and J segments are identical and the CDR3 region is sufficiently similar. For two CDR3 regions to be deemed sufficiently similar, two types of errors are considered: errors occurring in positions of low quality and errors occurring anywhere within the CDR3 region.
Running the tool
To run Immune Repertoire Analysis go to the Toolbox and select:
Tools | QIAseq Panel Expert Tools (![]() ) | Immune Repertoire Expert Tools (
) | Immune Repertoire Expert Tools (![]() ) | Immune Repertoire Analysis (
) | Immune Repertoire Analysis (![]() )
)
This opens a dialog where the trimmed reads can be selected. Click Next to configure the execution (see figure 8.8):
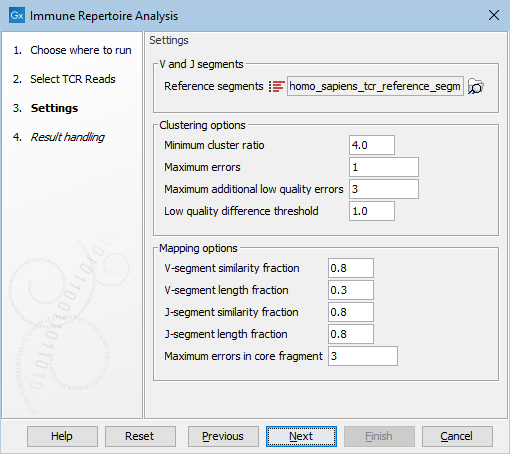
Figure 8.8: Options for configuring the execution of Immune Repertoire Analysis.
- Reference segments. The reference data sequence list containing the V and J segments.
- Minimum cluster ratio. A smaller clonotype is merged into a larger clonotype if the number of fragments associated with the larger clonotype is at least this number of times larger than the number of fragments in the smaller clonotype.
E.g. if the minimum cluster ratio is 4 and a clonotype has 8 fragments, only clonotypes with at most 2 (8 / 4 = 2) fragments will be considered for merging. A fragment represents one single read or a pair of reads.
- Maximum errors. Two clonotypes will be considered for merging if there is at most this number of differences between their CDR3 nucleotide sequences.
- Maximum additional low quality errors. Two clonotypes where the number of differences between their CDR3 sequences exceeds ``Maximum errors'' can still be considered for merging, if the number of additional errors at positions with low quality in the smaller clonotype does not exceed this number.
- Low quality difference threshold. A position is considered of low quality if the average quality is more than this number of standard deviations lower than the average quality at each position in the CDR3 sequence.
- V-segment similarity fraction. The minimum identity fraction between the aligned region of the read and the V segment.
- V-segment length fraction. Minimum fraction of the read that must match the V segment. As the read is expected to contain V, optionally D, and J segments, this fraction is expected to be considerably smaller than one.
- J-segment similarity fraction. The minimum identity fraction between the aligned region of the read and the J segment.
- J-segment length fraction. Minimum fraction of the J segment that must match the read. Note that this fraction is relative to the segment and not the read, as for V-segment length fraction. This fraction can be set to one if the read is expected to cover the whole J segment sequence.
- Maximum errors in core fragment. The maximum number of errors allowed in the 15 bp core fragment used for finding segment candidates for full pairwise alignment.
Output from the Immune Repertoire Analysis tool
Two different outputs are produced by the Immune Repertoire Analysis tool:
- T cell receptor (TCR) or B cell receptor (BCR) report (
 ). A report summarizing statistics of the detected clonotypes.
- TCR clonotypes (
 ) or BCR clonotypes (
 ). A table presenting chain type, V and J segments, CDR3 nucleotide sequence and length, CDR3 amino acid sequence, count and a column indicating whether the detected sequence is productive or not.
Report
The report includes the following information:
- Summary A summary table containing the number of
- input reads;
- input fragments, where each read pair is counted as one;
- fragments for which a V / J segment was identified;
- fragments that were successfully clonotyped;
- clonotyped fragments per chain type;
- unique clonotypes before and after merging.
Note that the V segment is identified first and the identification of the J segment is performed only for those fragments for which a V segment was found. Therefore, the number of fragments for which a J segment was identified will always be at most the same as the number of fragments for which a V segment is identified.
The remaining information in the report is given per chain type and only for those chain types for which clonotypes have been identified.
Note. All plots can be opened in table view by double-clicking on the plot and clicking on the table icon in the lower left corner.
- Diversity indices. Table containing diversity indices.
As it is likely that some rare clonotypes are missing in the sequencing data,
the extrapolated diversity indices give a projection of how many additional clonotypes there are
and what the diversity would have been if the sample had been sequenced deep enough to capture all clonotypes.
- Total number: The number of different clonotypes detected.
- Extrapolated diversity (chaoE): The extrapolated number of detected clonotypes by the method described in [Chao, 1987].
- Lorenz curve at 50% of total: The percent of clonotypes that account for 50% of the total fragment count. Also sometimes denoted as D50.
- Inverse Simpson's index: Let
 denote the fragment count for the
  th clonotype and let
 .
Then the inverse Simpon's index is defined as:
.
Then the inverse Simpon's index is defined as:

- Extrapolated Inverse Simpson's index (chaoE): The index by the method described in [Chao et al., 2014].
- Shannon-Wiener index: With and
 defined as above, the Shannon-Wiener index is defined as:

Note that the logarithm is the natural logarithm. To convert to base 2 logarithm the index can be multiplied by

- Extrapolated Shannon-Wiener index (chaoE): The index by the method described in [Chao et al., 2013].
- Rarefaction. A plot with rarefaction curve, also known as species accumulation curve (figure 8.9). It shows the expected number of distinct clonotypes discovered as a function of the total number of detected clonotypes, together with the confidence interval (CI), obtained from a normal approximation. The curve is
- interpolated down to 0 clonotypes;
- extrapolated to twice the total number of detected clonotypes.
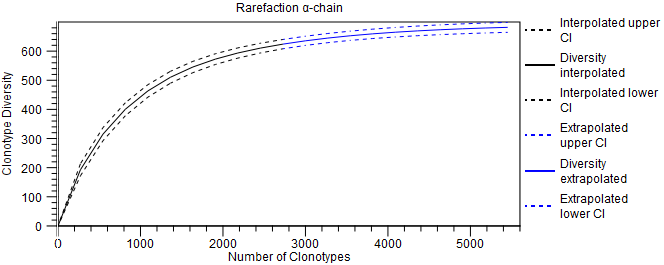
Figure 8.9: Rarefaction plot for the alpha-chain. - CDR3 length. A plot showing the length distribution of the CDR3 nucleotide sequences (figure 8.10).
Peaks are expected every 3 nt. due to repertoires consisting predominantly of in-frame CDR3 sequences, see figure 8.10.
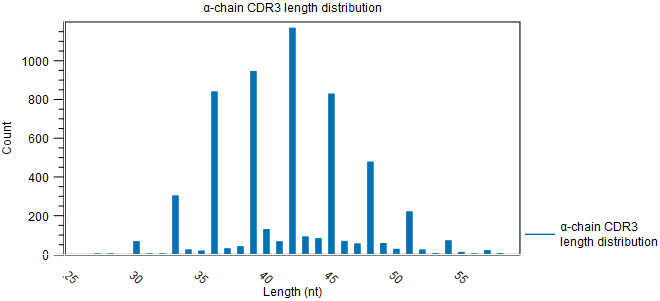
Figure 8.10: CDR3 length distribution plot for the alpha-chain with peaks every 3 nt. - V and J usage. Histograms for each chain and segment type showing the frequency of each of the detected V and J segments, respectively.
Double clicking the plot opens it in a new window.
A table view can be selected from the bottom pane, showing counts for all segments, see figure 8.11.
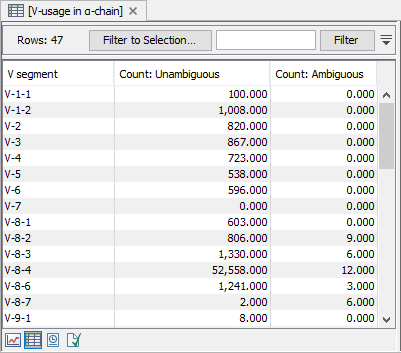
Figure 8.11: A full table showing segment usage can be obtained by double clicking the segment usage plot and selecting table view. - Cumulative frequencies of clonotypes. A plot showing the cumulative frequencies of the identified clonotypes ordered by descending fragment count.
If the curve is steep in the beginning and then flattens, it indicates that a few clonotypes accounts for most of the fragments.
If the curve on the other hand is more linear, it indicates a more even distribution of fragments among the clonotypes.
- Productive summary. The percentage distribution of CDR3 nucleotide sequences that are productive, out-of-frame or contain a premature stop codon
Clonotypes
The TCR clonotypes (![]() ) / BCR clonotypes (
) / BCR clonotypes (![]() ) output includes the following columns:
) output includes the following columns:
- Chain:
Which chain type the clonotype belongs to: TRA (
 ), TRB (
 ), TRG (
 ) and TRD (
 ) for TCR, or IGH (heavy), IGK (light
  ), and IGL (light
  ) for BCR. Note that other light BCR chain types are currently not supported.
- V and J: The identified V and J reference segment(s). If a single unambiguous V / J segment could not be identified, the segments will be listed separated by a comma.
- CDR3 nucleotide sequence: The nucleotide sequence for CDR3 including the V and J segment-encoded conserved amino acids.
- CDR3 amino acid sequence: The translated amino acid sequence for the CDR3 nucleotide sequence provided that it is in-frame.
- CDR3 length: The length of the CDR3 nucleotide sequence.
- Count: The number of times the specific CDR3 sequence was detected.
- Frequency (%): The count given as a percentage relative to the sum of all counts. Usually the frequencies add up to 100%, but note that if clonotypes are filtered (see Filter Immune Repertoire), the frequencies can add up to less than 100%.
- Productive:
One of three categories are used to characterize the CDR3 nucleotide sequences:
- Productive: sequences that are in frame and do not contain a premature stop codon;
- Out-of-frame: sequences that have a length that is not a multiple of three;
- Premature stop codon: sequences that are in-frame but contain a premature stop codon.
The clonotypes are sorted by count in decreasing order.