Create Methylation Database
The Create Methylation Database tool can create databases for two or three conditions that can be used by the Predict Methylation Profile. The tool is primarily designed for use with the QIAseq Targeted Methyl panel, e.g., "T Cell Infiltration Panel (MHS-202Z)" where Fibroblast, Epithelial and Immune cells can be distinguished, further the tool is useful for creating Tumor/Normal databases for other QIAseq Targeted Methyl Cancer Panels. In addition, it can in principle be used to construct databases for any pure sample conditions where sufficient methylation differences exist.
To start the tool, go to:
Toolbox | Epigenomics Analysis (![]() ) | Bisulfite Sequencing (
) | Bisulfite Sequencing (![]() )| Create Methylation Database (
)| Create Methylation Database (![]() )
)
In the first dialog, choose pure sample methylation levels tracks produced by the tool Call Methylation Levels for two or three types. It is possible to use multiple tracks for each condition. It is recommended that the Call Methylation Levels tool has been run with the option to Report unmethylated cytosines. Specify the name of each condition matching the tracks selected, see figure 14.10.
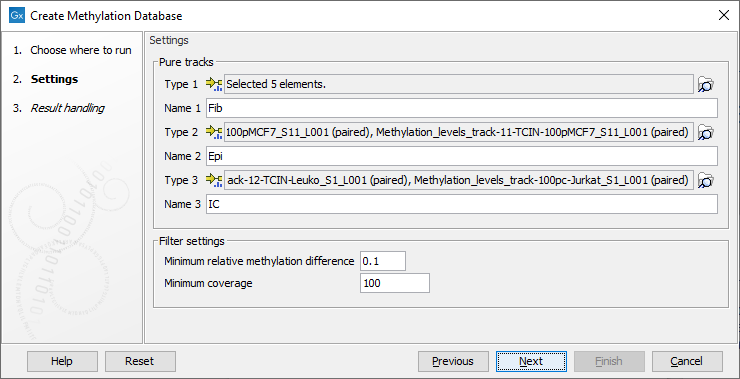
Figure 14.10: Wizard step showing selection of pure tracks, naming and setting filters.
Two filter options are available to specify how stringent the selection should be:
- Minimum relative methylation difference The minimum relative difference in methylation level allowed to include the CpG site in the database. Choose a value between 0.5 and >0.0 (default = 0.1). The choice will affect how many sites are selected and how much they differ. Different settings are shown in figure 14.11.
- Minimum coverage Minimum coverage in all samples for a CpG site to be considered. When the coverage is assessed across more pure samples of each type, both the main and complement strand coverage are calculated across the samples and the average is used.
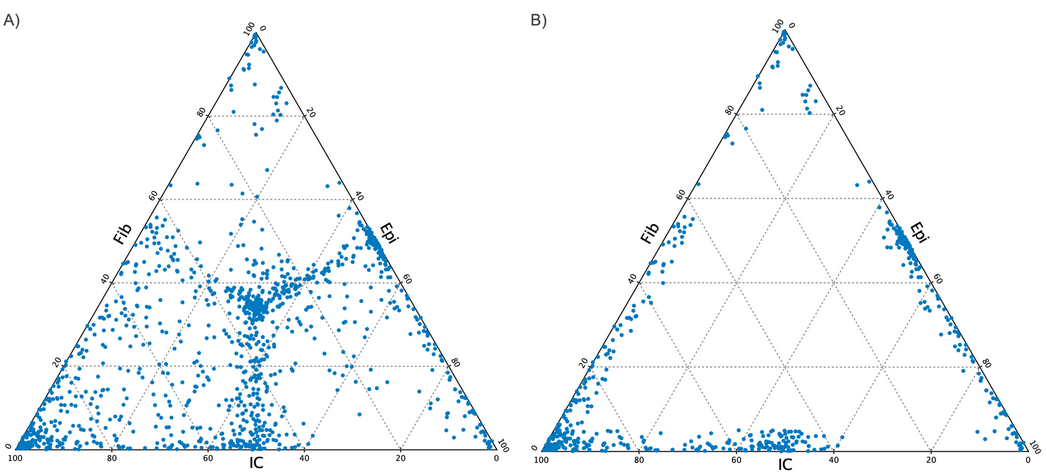
Figure 14.11: Ternary plot created in the report when selecting three types of pure samples, Fib, Epi and IC for two different values of "minimum relative methylation difference". A) minimum relative methylation difference = 0.5, so all sites are selected. Note that the middle of the plot is populated and that these sites do not differ in methylation level between types, hence representing non-informative sites."B) A low value of the relative methylation difference illustrating a high difference between the types.
We strongly recommend experimenting with the parameters to identify more optimal settings as these would differ between different experiments.
Click Next. The generated report will be valuable when assessing the constructed database.
The Create Methylation Database algorithm
The tool takes either two or three types of pure cells or conditions each represented by as many samples as wanted (one sample per track). It is recommended that the Call Methylation Levels tool has been run with the option to Report unmethylated cytosines when producing the tracks. The algorithm is constructed around two parameters, one for assessing coverage and one for specifying differences in methylation between the samples. A filtering cascade is used internally by the tool:
- Step 1 Select all CpG sites.
- Step 2 Keep only sites where a methylation level is assigned in all the tracks.
- Step 3 The population variance in methylation level within the set of input tracks for each pure type is less than 0.2". You can see sites filtered by this in the report, they will be reported as "Filtered due to inconsistent methylation level in pure samples
- Step 4 Remove sites where the average coverage in the tracks for any type is below the Minimum coverage parameter.
- Step 5 Remove sites where the average methylation across all samples is < 0.1. These are reported as "Filtered due to too low methylation level across samples"
- Step 6 One of the cell type has a sufficiently different methylation level compared to the other cell types, defined by the minimum relative methylation difference parameter.
The Create Methylation Database report
The tool provides a report with a summary of selected sites. If no sites fulfill the criteria only the summary is available.
- Summary
- Included CpC Sites The number of CpG sites in the database that is created.
- Filtered CpG sites The total number of removed CpG sites.
- Filtered due to low coverage The number of sites removed in step 4 of the algorithm.
- Filtered due to inconsistent methylation level in pure sample The number of sites removed in step 3 of the algorithm.
- Filtered due to too low coverage across samples The number of sites removed in step 5 of the algorithm.
- Filtered due to too small relative difference The number of sites removed in step 6 of the algorithm.
- Total CpG sites The number of CpG sites in the data set.
- Included cell types a list of the included names.
In section 3 of the report the range of methylation values are shown for each of the pure input types. It is important that the hypo and hyper methylation levels is about the same within a category such that they can contribute evenly in the selected sites. This will provide the best estimates.
Finally in section 4, either a histogram or a ternary plot, depending on number of input types, illustrates the relative methylation levels across the selected CpG sites for the database. the ternary plot is illustrated in figure 14.11.
The Create Methylation Database database track
The output database track contains information on:
- Chromosome The chromosome number.
- Region The position of the CpG sites.
- Name A combination of chromosome and region prefixed by "Site_".
- One column for each of the cell types in the database The column contains the expected methylation level for the particular cell type. The header is the name of the type.
The produced track can be used as the input database for the Predict Methylation Profile tool. Validation can be done by creating mixtures with known amounts of each type.