Output from Validate QIAseq Read Structure (beta)
Validate QIAseq Read Structure (beta) generates a report containing a summary section with information about whether the sample matches the expected read structure, and a read structure section showing plots of the read structure and a comparison of the expected and predicted structures. For paired end reads there are two read structure sections, since the two reads are handled separately.
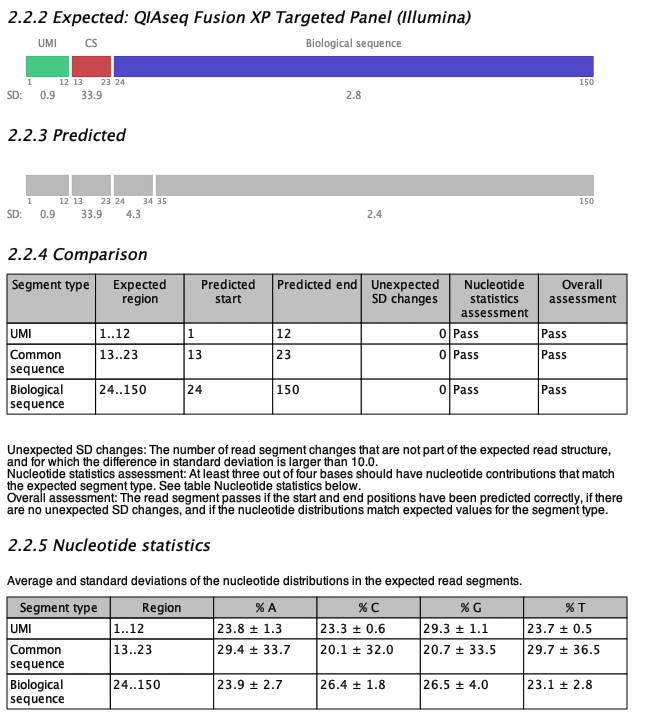
Figure 5.8: An example of expected and predicted read structures from a read structure report when analyzing a QIAseq Fusion XP Targeted Panel Illumina sample.
An example of the read structure section is shown in figure 5.8 for a QIAseq Fusion XP Targeted Panel (Illumina) sample. The expected read structure of R2 is plotted in section 2.2.2 of the report; the QIAseq Fusion XP R2 read consists of a UMI, a common sequence and a biological sequence. Colored boxes represent read segments and the segment types are labeled above the segments (CS for common sequence). The start and end positions are shown underneath each segment together with the Standard Deviation (SD) of the segment as a measure of the nucleotide variation within the region. The segment SD is calculated as the SD of the nucleotide distribution in the region for each of the four DNA nucleotides, then averaged over the four nucleotides.
The predicted read structure is plotted in section 2.2.3 of the report. Grey boxes represent predicted read segments and similar to the expected read segments, they are labeled with SD values and start and end positions.
The expected and predicted read structures are compared in table 2.2.4. The table has a row for each expected segment. In figure 5.8, the start and end positions of all segments are predicted correctly, but the biological sequence is predicted as two segments with an additional break at position 34. The SD of the two biological regions are 4.3 and 2.4, respectively (shown under the plot in section 2.2.3 Predicted). Thus, the SD difference between the two regions is only 1.9, which is smaller than the default threshold of 10, and the difference is therefore not problematic and not included in the comparison table in the column 'Unexpected SD changes'.
Finally, table 2.2.5 Nucleotide statistics, shows the average and SD values of the four DNA nucleotide contributions in each of the expected read segments. Cells are highlighted in yellow if a read segment does not match the expected values (average and SD) for that type of segment. In this case all four nucleotide pass for all segments, and all cells are white.
If the sample does not match the expected read structure, it is highlighted in the Summary table of the report as shown in figure 5.9, where a QIAseq Fusion XP Targeted Panel Illumina sample is analyzed with the expected read structure QIAseq Targeted Methyl Panel. Yellow cells in the Comparison and Nucleotide statistics tables highlight where the comparison fails. In this case, the UMI and the biological sequence fail the comparison, while the common sequence pass (both QIAseq Targeted Methyl Panel and QIAseq Fusion XP Targeted Panel have a common sequence in positions 13-24 on R2).
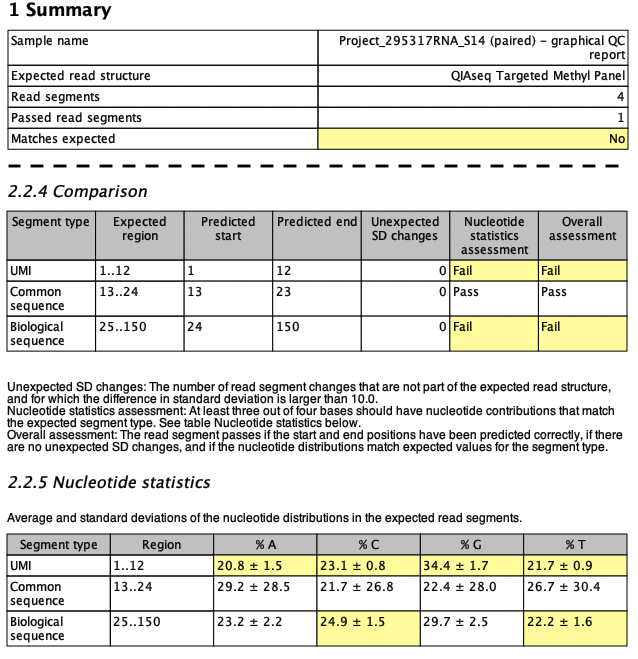
Figure 5.9: Snippets from a failed read structure report when analyzing a QIAseq Fusion XP Targeted Panel Illumina sample using the QIAseq Targeted Methyl Panel as expected read structure.
For the UMI, the nucleotide distribution fails for all four bases. This is due to the fact that methylated UMIs have the form NNC (where N is random) and to pass the nucleotide statistics assessment, the sample should have SD values larger than 3 for T, larger than 8 for A and G, and larger than 20 for C. In addition, the biological sequence on R2 fails for C and T. C is supposed to have an average contribution smaller than 8% while T is supposed to have an average contribution larger than 35% in biological regions. As mentioned earlier, the segment comparison could also fail if start or end positions of the expected read segments are not detected or if any additional segments are predicted with sufficiently large SD changes.
If the sequence protocol is unknown or not included in the list of supported protocols, the expected QIAseq read structure can be set to 'Unknown' to produce a report that only contains the predicted read structure and no comparison. An example is the QIAseq miRNA format, that is a bit tricky to analyze given the protocol, see figure 5.10. The structure consists of the miRNA segment, a common sequence, the UMI and an adapter/junk in that order. However, the miRNA sequence itself can vary in length making the read structure less predictable. It is possible to optimize the parameters in a way that the tool will predict the most likely structure of most reads in the sample.
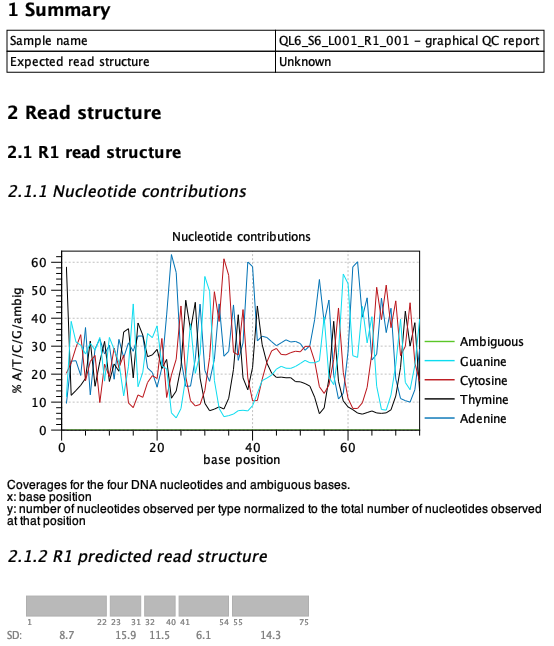
Figure 5.10: The read structure report from Validate QIAseq Read Structure (beta) when analyzing a QIAseq miRNA sample. The parameters were tweaked to obtain the most likely structure by setting the sensitivity to high and using a smaller window size of 6.
The predicted read structure plot can be compared to the nucleotide contributions above to get an idea of the sequence type for each of the predicted segments. This can help decide if there are potential adapters that need to be trimmed. In the miRNA example from figure 5.10 the tool predicts the miRNA to be 22 bp long, which matches the length of most miRNAs. It can also identify the UMI (positions 41-54), but struggles a bit more with the common sequence which is staggered and does not align for the individual reads (the common sequence for this kit is AACTGTAGGCACCATCAAT). The staggered common sequence makes it hard to predict the exact start and end positions, which is the reason for the tool not supporting this protocol.