Create Methylation Level Heat Map
The Create Methylation Level Heat Map tool generates a two dimensional heat map of methylation levels. Each column corresponds to a sample, and each row corresponds to a feature (a single CpG site or a larger target region including multiple CpG sites, e.g. promoter regions). A hierarchical clustering of the samples is performed. For up to 5000 features, a hierarchical clustering of features is also performed.
Calculation of the methylation levels is performed across all CpG sites in a given target. When the coverage of a CpG site is lower than a specified threshold, that site will be considered zero methylated, indicating that it is uninformative. For targets containing multiple CpG sites, only informative sites are considered and the methylation level is averaged across all the informative sites. For targets containing only a single CpG site, the methylation level is considered only for that site.
Clustering of features and samples
Features are clustered according to the similarity of their methylation level profiles over the set of samples. Samples are clustered according to the similarity of their methylation level patterns over the set of features.
The clustering has a tree structure that is generated by:
- Letting each feature or sample be a cluster.
- Calculating pairwise distances between all clusters.
- Joining the two closest clusters into one new cluster.
- Iterating 2 to 3 times, until a single cluster, containing all the features or samples, remains.
The tree is drawn such that the distances between clusters are reflected by the lengths of the branches in the tree.
Running the tool
Go to:
Tools | Epigenomics Analysis (![]() ) | Bisulfite Sequencing (
) | Bisulfite Sequencing (![]() ) | Create Methylation Level Heat Map (
) | Create Methylation Level Heat Map (![]() )
)
The tool takes as input methylation level tracks (![]() ) generated using the Call Methylation Levels tool with the "Report unmethylated cytosines" option selected, as shown in figure 10.25. This option is enabled by default when running the Analyze QIAseq Methyl (Illumina) workflow.
) generated using the Call Methylation Levels tool with the "Report unmethylated cytosines" option selected, as shown in figure 10.25. This option is enabled by default when running the Analyze QIAseq Methyl (Illumina) workflow.
For valid comparisons to be made across samples, the inputs must have been generated using the same reference information, i.e. the same reference genome, target regions, etc.
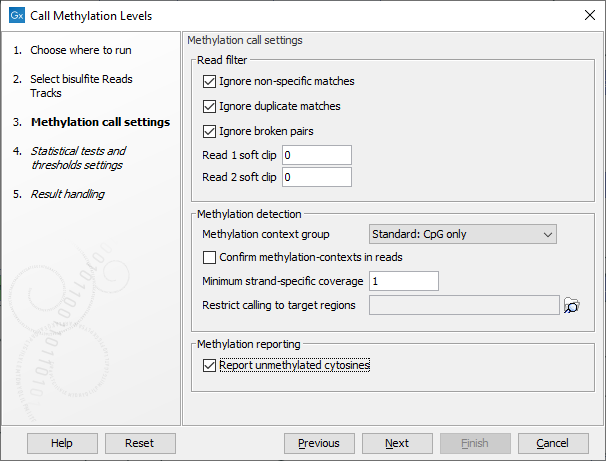
Figure 10.25: The "Report unmethylated cytosines" option in Call Methylation Levels should be enabled when generating methylation level tracks for use with Create Methylation Level Heat Map.
In the wizard step shown in figure 10.26, select the target region track containing the CpG sites. These may be single CpGs or larger targets (e.g. promoter regions). If no target region track is selected, single CpG sites from the methylation level tracks are used as features in the heat map.
At the bottom of this step, specify the minimum CpG site coverage value. CpG sites with coverage below this will be excluded from the analysis. By default, the value is 30. When only single CpG sites are analyzed, the methylation level of low coverage sites is set to 0.
A distance measure and a cluster linkage method for the hierarchical clustering is also specified here. The distance measure specifies how distances between two features or samples should be calculated. The cluster linkage method specifies how the distance between two clusters, each consisting of a number of features or samples, should be calculated.
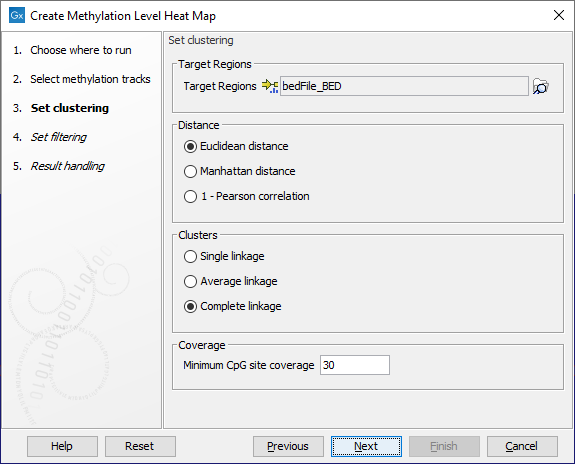
Figure 10.26: The core options for Create Methylation Level Heat Map.
There are three kinds of distance measures:
- Euclidean distance. The length of the segment connecting two points. If
 and
and
 , then the Euclidean distance between
  and
and  is
is

- Manhattan distance. The distance between two points measured along axes at right angles. If
and
, then the Manhattan distance between and is

- 1 - Pearson correlation. The Pearson correlation coefficient between
 and
and
 is defined as
where
is defined as
where
 and
and  are the average and sample standard deviation, respectively, of the values in
  values.
The Pearson correlation coefficient ranges from -1 to 1, with high absolute values indicating strong correlation, and values near 0 suggesting little to no relationship between the elements.
Using 1 - | Pearson correlation | as the distance measure ensures that highly correlated elements have a shorter distance, while elements with low correlation are farther apart.
The distance between two clusters is determined using one of the following linkage types:
- Single linkage. The distance between the two closest elements in the two clusters.
- Average linkage. The average distance between elements in the first cluster and elements in the second cluster.
- Complete linkage. The distance between the two farthest elements in the two clusters.
Filtering options are specified in the next step, as shown in figure 10.27.
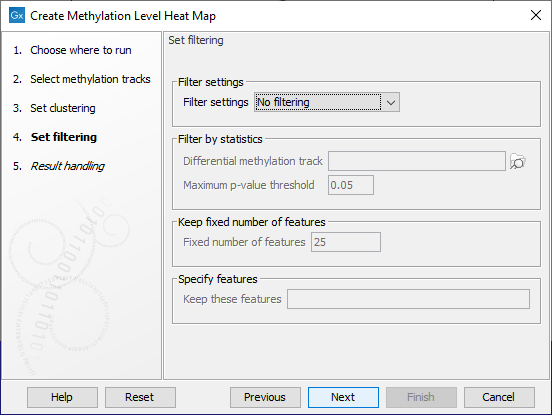
Figure 10.27: The features to include in results can be customized using filtering options.
The Filter settings options are described below. Some require additional information be provided in the sections underneath.
- No filtering All features are reported in the outputs.
- Filter by statistics Only features meeting specified p-value and fold change thresholds in a differential methylation track you supply are reported in the outputs. Differential methylation tracks can be generated by running Detect Differentially Methylated Regions from the Analyze QIAseq Panel tool, as described in Finding differentially methylated regions.
- Fixed number of features Only the specified number of features with the highest index of dispersion (the ratio of the variance to the mean) are reported in the outputs.
- Specify features Only the features listed in the "Keep these features" field are included in the outputs. Enter the list of feature names, separated by white-space characters, commas or semi-colons. Note: This option can only be used if names have been defined for the target regions.
Create Methylation Level Heat Map generates two outputs: a heat map and a methylation expression track.
The methylation level heat map
Each row in the heat map corresponds to a feature (target region or single CpG site). Each column corresponds to a sample. The color in the ![]() 'th row and
'th row and ![]() 'th column reflects the methylation level of feature
'th column reflects the methylation level of feature ![]() in sample
in sample ![]() . The color scale and other settings can be set from the Side Panel.
. The color scale and other settings can be set from the Side Panel.
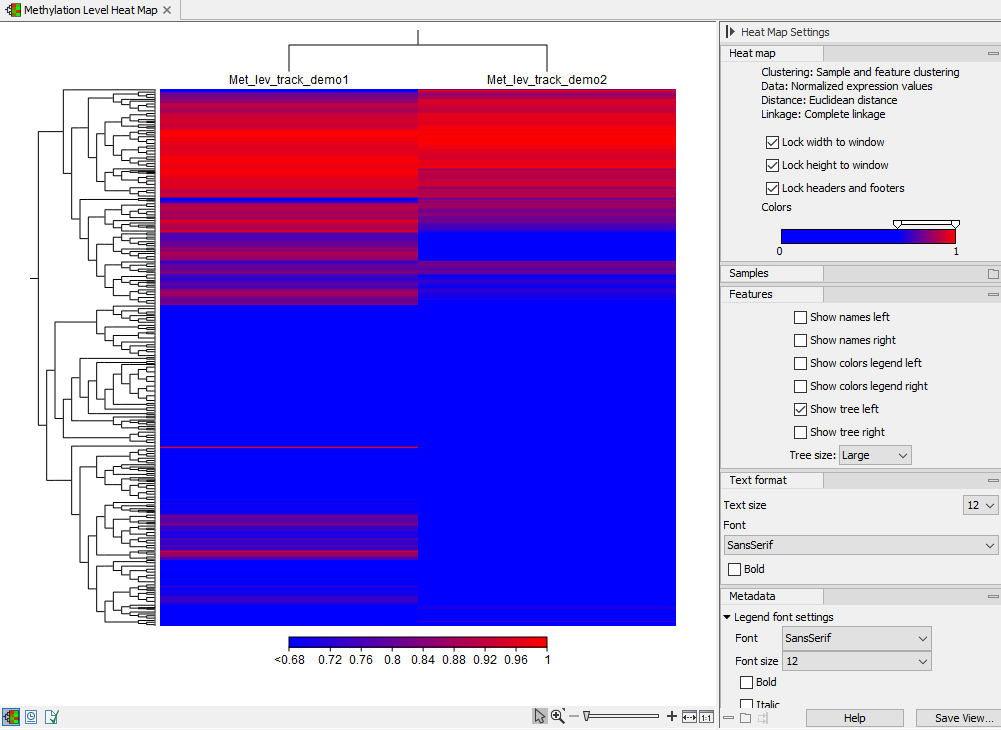
Figure 10.28: A methylation level heat map.
The methylation expression track
The methylation expression track includes information from all the samples provided as input. It can be viewed as a graphical track (![]() ) or as a table (
) or as a table (![]() ), as shown in figure 10.29.
), as shown in figure 10.29.
The following information is available for each feature:
- Chromosome The chromosome number
- Region The position of the target region on the chromosome
- Expression value Not relevant for this analysis type. All values in this column are reported as NaN.
The following four columns are provided for each sample, with the relevant sample name appended to the column name.
- Total methylated coverage Coverage of all informative methylated CpG sites
- Total context coverage Coverage of all informative CpG sites
- Total methylation level The coverage of informative methylated CpG sites divided by the coverage of all informative CpG sites
- Valid CpG sites The number of strand specific CpG sites included in the target region that meet the minimum CpG site coverage configured in the wizard step shown in figure 10.26
Viewing selected features
The heat map and methylation expression track created by Create Methylation Level Heat Map are linked. Selected elements in one of these outputs can be highlighted in the other. Open both outputs, preferably in a split view, and then:
- After selecting rows of interest in a heat map, right click and choose Select Names in Other Views from the menu, or
- After selecting rows of interest in the methylation expression track table, click on the Select Names in Other Views button.
The selections made in one of the outputs will now be selected in the other.
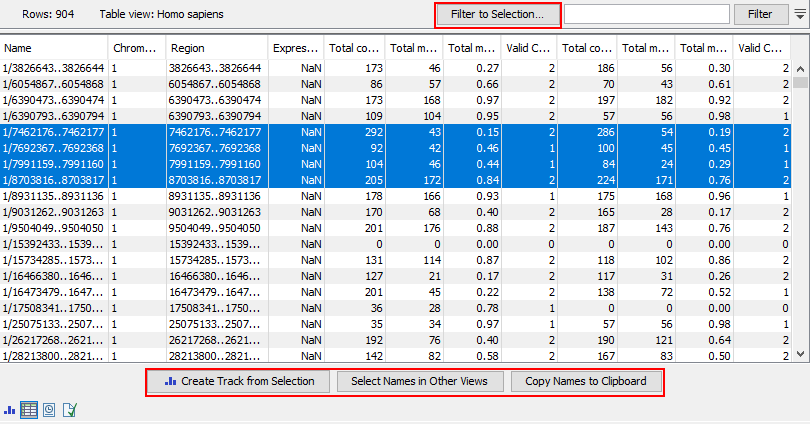
Figure 10.29: Methylation level results shown in a table view. After selecting rows in the table, the buttons highlighted can be used to work with the selection in various ways.
Viewing results in context using a track list
Methylation expression tracks can be included in a track list with other relevant tracks, such as read mapping and annotation tracks, as shown in figure 10.30.
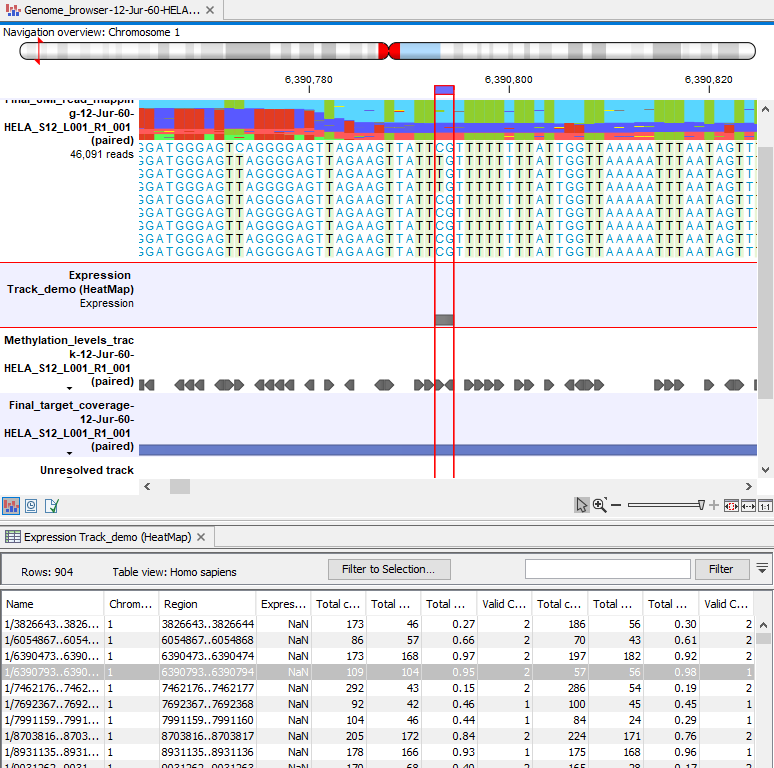
Figure 10.30: Methylation results in the context of a track list, with the table view of the methylation expression track open in the bottom of the split view.