Detect Wells for UPXome
In the following sections we describe the different options available for analyzing samples generated by the QIAseq UPXome RNA kit. It is possible to view which plate wells contain reads and compare this to the wells that were intended to be used. Samples can be analyzed in two ways, either by running the workflow through the QIAseq Panel Analysis Assistant (see QIAseq Panel Analysis Assistant) or by using one of the QIAseq UPXome workflows. Common to both are that they require Barcodes for demultiplexing. These Barcodes have been built into the workflow when running through the QIAseq Panel Analysis Assistant, but can also be found as a reference element in the QIAseq UPXome and FastSelect RNA hg38 data set.
The UPXome application of the QIAseq Panel Analysis Assistant offers a Detect Wells tool which can be run to verify the presence of reads in the expected plate well positions. The preview shows how reads are distributed in wells and produces a list of user selected wells and their barcodes. The list can be used as an input to the QIAseq UPXome workflows. The Detect Wells tool is only available through the QIAseq Panel Analysis Assistant.
Click Run to open the wizard. In the first dialog, select the input reads, and click Next.
In the following dialog (figure 14.11)
- Specify whether a mismatch per barcode should be allowed.
- Select all the wells used in the experiment in the diagram in the Select wells area (details below).
Selecting the wells used
A diagram of the 96 well plate, is shown in the Select wells area. Wells identified automatically as being used in the experiment are shaded in blue. A well is identified automatically if has at least 0.5% as many reads as the well with the maximum number of reads.
All wells used in the experiment must now be selected. Select wells using functionality associated with the plate diagram, and buttons below it:
- Select a single well by clicking on it in the plate diagram.
- Select individual rows and columns using the checkboxes located to the right and below the diagram.
- Select all wells with the Select All button.
- Deselect all selected wells with the Deselect All button.
- Select only the wells that were automatically detected with the Select Detected button.
- Invert the current selection with the Invert button. Using this button, all selected wells are deselected, and vice versa.
Selected wells are indicated by a dark blue circle around the well. When you click on Next, it is the barcodes and plate location for these wells that will be output. The generated table can now be used directly in the QIAseq UPXome workflows and will only contain wells with content.
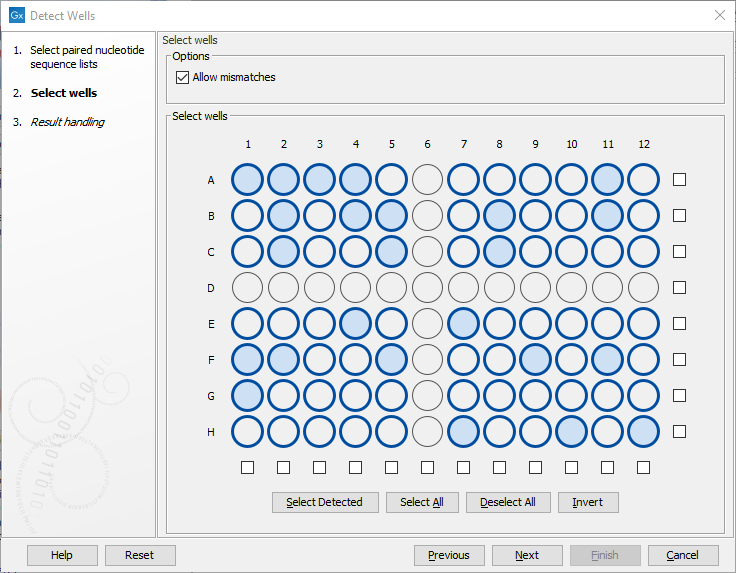
Figure 14.11: Wells identified automatically as being used in the experiment are shaded in light blue. Here, all wells except row D and column 6 have been selected for use.
Outputs of Detect Wells
A list of the selected wells and their barcode and location on the plate is output, see figure 14.12. The list can be used when running the Quantify UPXome workflows from the assistant. It can also be exported to a file for running the same workflow directly from the toolbox. The list is also compatible with the Demultiplex Reads tool that can be run to create the demultiplexed samples without further processing.
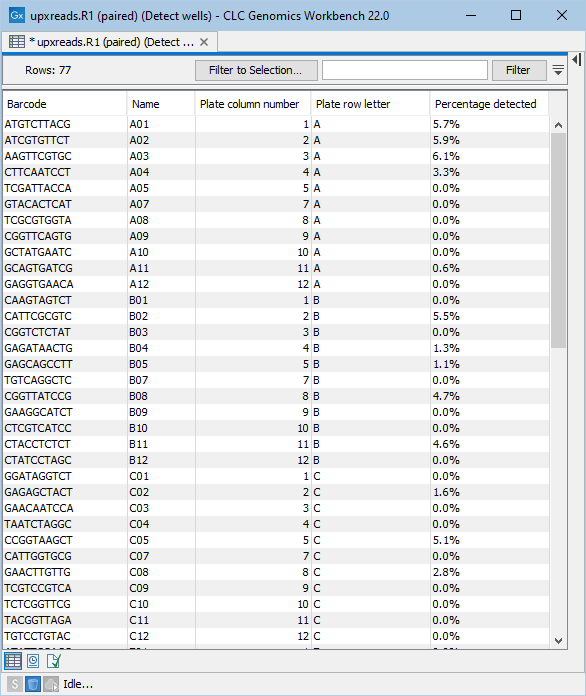
Figure 14.12: Table listing the selected wells to be used when running the Quantify QIAseq UPXome workflows.