Identify Known Variants in One Sample (WGS)
The Identify Known Variants in One Sample (WGS) template workflow combines data analysis and interpretation. It should be used to identify known variants as specified by the user (e.g., known breast cancer associated variants) for their presence or absence in a sample. This workflow will not identify new variants.
The workflow maps the sequencing reads to a human genome sequence and does a local realignment of the mapped reads to improve the subsequent variant detection. In the next step, only variants specified by the user are identified and annotated in the newly generated read mapping.
Before starting the workflow, you may need to import your known variants in GVF or VCF format using Import | Tracks.
Run the Identify Known Variants in One Sample (WGS) workflow
- To run the Identify Known Variants in One Sample (WGS) template workflow, go to:
Workflows | Template Workflows | Biomedical Workflows (
 ) | Whole Genome Sequencing (
 ) | General Workflows (WGS) (
 ) | Identify Known Variants from One Sample (WGS) (
 )
)
- First select the trimmed sequencing reads of the sample that should be tested for presence or absence
of your known variants (figure 17.7).
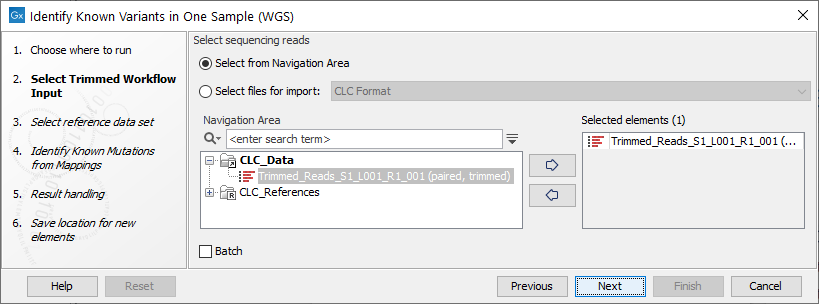
Figure 17.7: Select the trimmed sequencing reads from the sample you would like to test for your known variants.If several samples from different folders should be analyzed, the tool has to be run in batch mode. This is done by selecting "Batch" and specifying the folders that hold the data you wish to analyse.
- In the next wizard step, select the reference data set should be used to identify the known variants (figure 17.8).
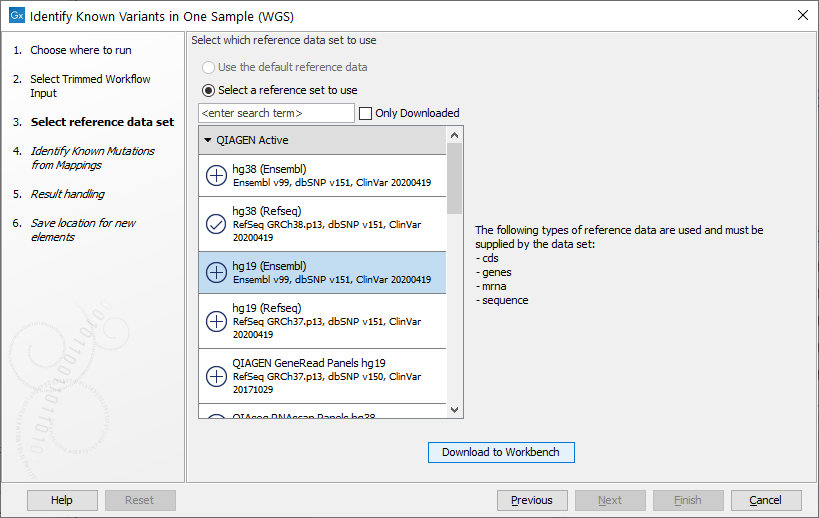
Figure 17.8: Choose the relevant reference Data Set to identify the known variants. - In the Identify Known Mutations from Mappings, select a variant track containing the known variants you want to identify in the sample (figure 17.9).
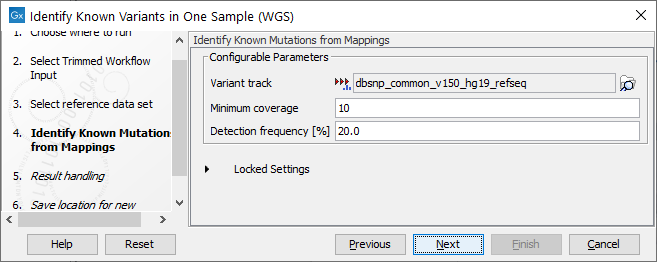
Figure 17.9: Specify the track with the known variants that should be identified.The parameters that can be set are:
- Minimum coverage The minimum number of reads that covers the position of the variant, which is required to set "Sufficient Coverage" to YES.
- Detection frequency The minimum allele frequency that is required to annotate a variant as being present in the sample. The same threshold will also be used to determine if a variant is homozygous or heterozygous. In case the most frequent alternative allele at the position of the considered variant has a frequency of less than this value, the zygosity of the considered variant will be reported as being homozygous.
The parameter "Detection Frequency" will be used in the calculation twice. First, it will report in the result if a variant has been detected (observed frequency > specified frequency) or not (observed frequency <= specified frequency). Moreover, it will determine if a variant should be labeled as heterozygous (frequency of another allele identified at a position of a variant in the alignment > specified frequency) or homozygous (frequency of all other alleles identified at a position of a variant in the alignment < specified frequency).
- In the last wizard step you can check the selected settings by clicking on the button labeled Preview All Parameters.
In the Preview All Parameters wizard you can only check the settings, and if you wish to make changes you have to use the Previous button from the wizard to edit parameters in the relevant windows.
- Choose to Save your results and click Finish.
Output from the Identify Known Variants in One Sample (WGS) workflow
The Identify Known Variants in One Sample (WGS) tool produces four different output types.
- Read Mapping Report (
 ) The report consists of a number of tables and graphs that in different ways provide information about the mapped reads.
- Read Mapping (
 ) The mapped sequencing reads. The reads are shown in different colors depending on their orientation, whether they are single reads or paired reads, and whether they map unambiguously (see http://resources.qiagenbioinformatics.com/manuals/clcgenomicsworkbench/current/index.php?manual=Coloring_mapped_reads.html).
- Variants Detected in Detail (
 ) Annotation track showing the known variants. Like the "Overview Variants Detected" table, this table provides information about the known variants. Four columns starting with the sample name and followed by "Read Mapping coverage", "Read Mapping detection", "Read Mapping frequency", and "Read Mapping zygosity" provides the overview of whether or not the known variants have been detected in the sequencing reads, as well as detailed information about the Most Frequent Alternative Allele (labeled MFAA).
- Track List Identify Known Variants (
 ) A collection of tracks presented together. Shows the annotated variant track together with the human reference sequence, genes, transcripts, coding regions, target regions coverage, the mapped reads, the overview of the detected variants, and the variants detected in detail.
It is a good idea to start looking at the mapping report to see whether the coverage is sufficient in the regions of interest (e.g. > 30 ). Please also check that at least 90% of the reads are mapped to the human reference sequence.
When this has been done you can open the Track List file (see 17.10).
The Track List includes the overview track of known variants and the detailed result track in the context to the human reference sequence, genes, transcripts, coding regions, targeted regions, and mapped sequencing reads.
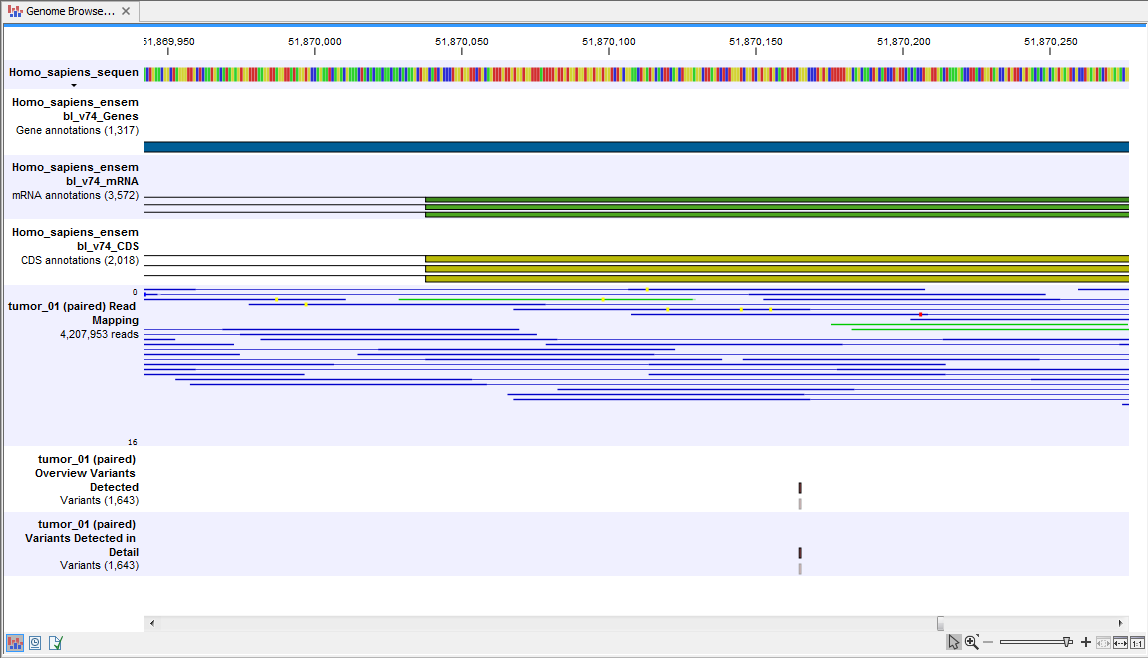
Figure 17.10: Track List that allows inspection of the identified variants in
the context of the human genome and external databases.
Finally, a track with conservation scores has been added to be able to see the level of nucleotide conservation (from a multiple alignment with many vertebrates) in the region around each variant.
Open the annotated variant as a table showing all variants and the added information/annotations (see 17.11).
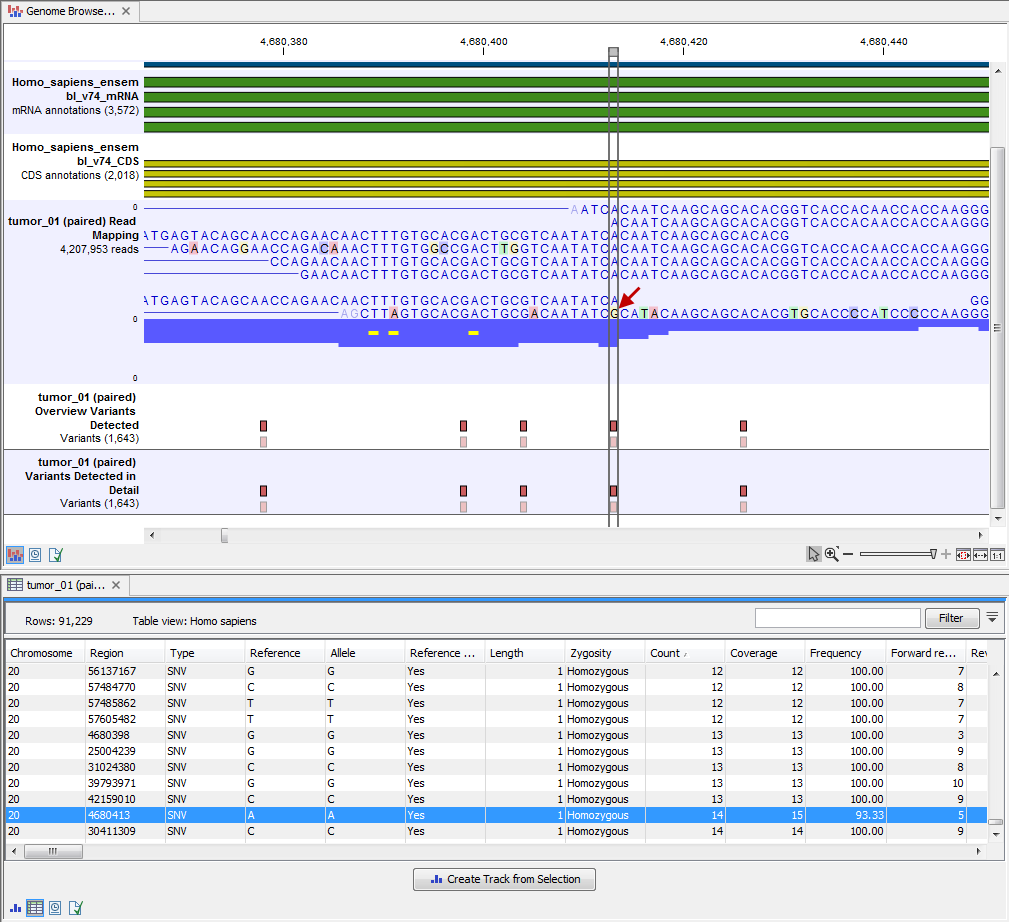
Figure 17.11: Track List with an open overview
variant track with information about if the variant has been detected or not,
the identified zygosity, if the coverage was sufficient at this position and
the observed allele frequency.
Note We do not recommend that any of the produced files are deleted individually as some of them are linked to other outputs. Please always delete all of them at the same time.