Quality Control for the Identify QIAseq DNA Variants workflow
The Template QIAseq DNA Workflows for variant analysis have been configured by default to address general needs, provided that the data quality fulfills minimal standards of coverage, proper library preparation, and appropriate reads/UMI structure. We do recommend running the workflow from the QIAseq Panel Analysis Assistant a first time using the default configuration, and then inspect the QC reports: the UMI Groups Report and the Create UMI Report.
The following subsections describe how to perform proper quality controls and why they are important. For example, the relationship between the number of reads per UMI and the original coverage is not straightforward: if the original molecule has been amplified many times, the resulting, seemingly deep, coverage will not add much information. So when the quality criteria are not fulfilled, we cannot guarantee the validity of the variant calls. After reviewing the quality controls described in this section, you can adjust workflows parameters and re-run the workflow in order to address specific experimental conditions. Parameters can be modified by opening a copy of the workflow and configuring workflow elements individually, as described at http://resources.qiagenbioinformatics.com/manuals/clcgenomicsworkbench/current/index.php?manual=Basic_configuration_workflow_elements.html.
All figures in these subsections are based on three different samples that were analyzed with the QIAseq DHS-6600Z Human Tumor Mutational Burden Panel. The sample pictured to the left in each figure is a sample with few reads per UMI, the sample shown in the middle is an example of an ideal good quality sample and the one pictured to the right in each figure represents a sample with too many reads per UMI. All three samples are real samples and therefore also have different numbers of input reads which also needs to be taken into account when performing the quality control of the samples.
Proportion of reads per UMI group
According to the QIAseq Targeted DNA panel Handbook and protocol, and depending on the input DNA for the library preparation, the ideal value for Average reads per group should be 2 to 4, with 4 being the best value for the highest DNA input (i.e., 40ng). This value can be found in the Groups table of the "UMI Groups report" (see red highlight in figure 12.9).
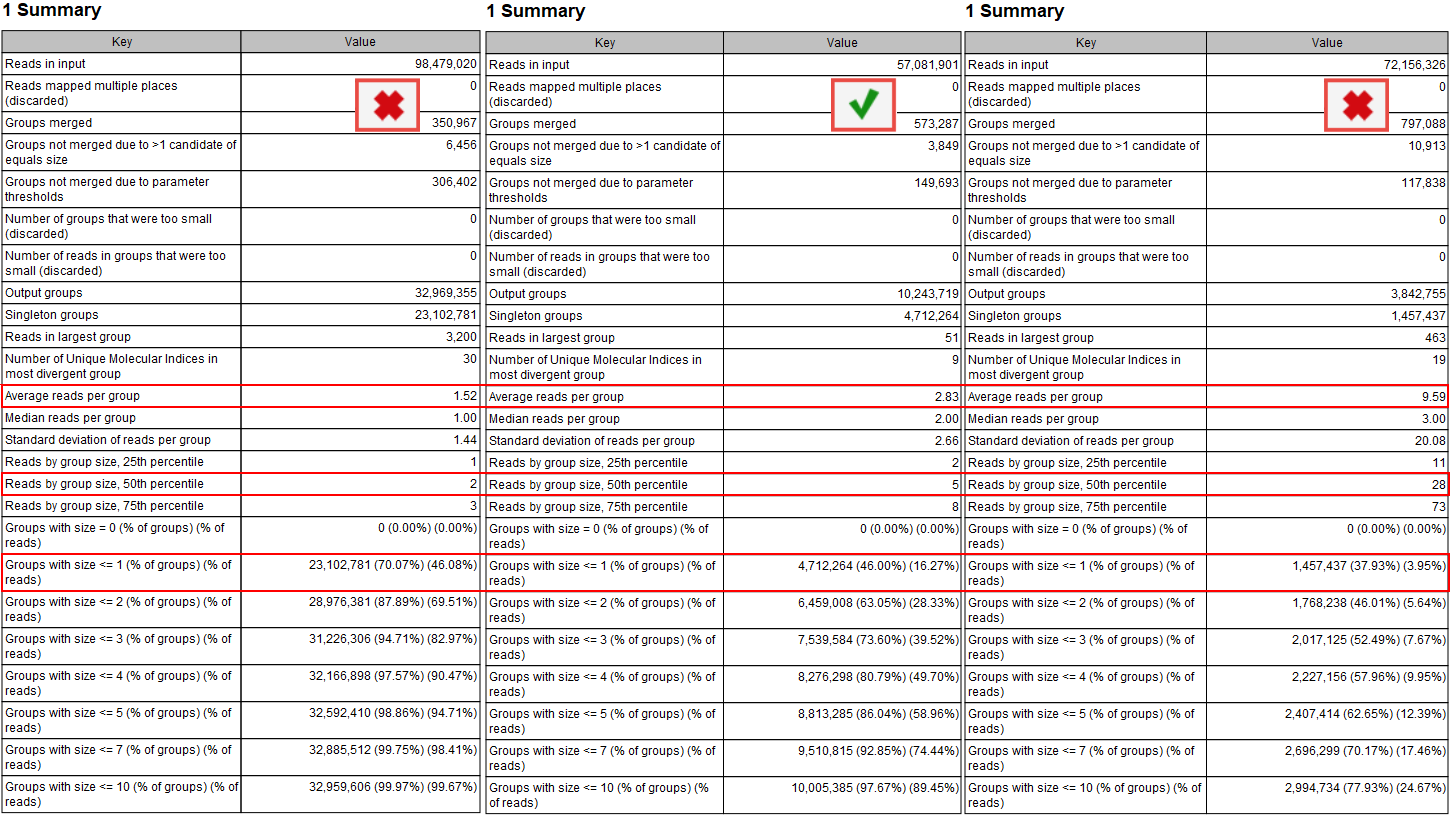
Figure 12.9: Summary section of the UMI group report.
Average reads per group values smaller than 2 will make it impossible to create a consensus read, and therefore difficult to improve the Q scores and achieve higher precision (the advantage of using UMIs in the first place). In this case, Average quality should be adjusted for the Identify candidates variants (Low average quality variants).
Similarly, if the value is more than 6 to 8, it indicates that not enough DNA input in the library preparation resulted in an excessive PCR amplification of the same fragments. This in turn leads to decreased efficiency of the library and a lower UMI coverage as a result of creating consensus across many reads per group. As the filtering of the variants depends on the counts (number of times a variant is observed at a UMI read), the Count filters might need further adjustments (available for Illumina workflows when configuring the Identify Candidate Variants tools for Low, Medium and High counts).
Reads by group size, 25th, 50th and 75th percentile shows the distribution of reads by group size. Examples from the figure where the 50th percentile is 5 meaning that half the reads will be in UMI groups containing up to 5 reads. If the 75th percentile is 73 it mean that 75 percent of all reads are in UMI groups containing up to 73 reads. The histogram shows the distribution of all reads by groups.
Proportion of singletons
The proportion of singletons indicates how many UMI barcodes are shared across different reads. If the number is too high, this corresponds to a very low number of reads per UMI on average. This value can be found in the Groups table (see red highlight in figure 12.9) and assessed with the Read by group size plot (figure 12.10) of the "UMI groups report". When the proportion of singletons is too high, you can modify the Average quality and Count filters as described above.
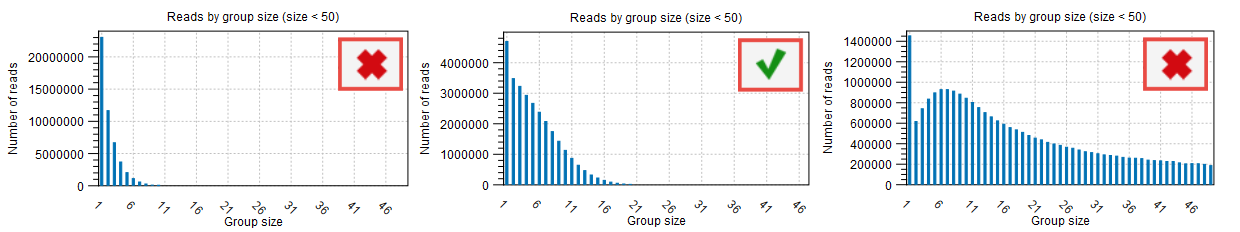
Figure 12.10: Distribution of reads by group size also showing the proportion of singletons as seen in the UMI Groups report
Median Q scores
The median Q score is correlated to the generation of a good consensus among reads with the same UMIs. When there are not enough "big UMI" reads (i.e., reads created out of consensus of 2 or more reads carrying the same UMI barcode), the Q scores will be similar to the original Q scores calculated for the raw sequencing. In this case, you cannot benefit of stringent filtering based on average Q scores that are expected to improve by the creation of UMI reads.
The improvements of the Q score values can be inspected in the report called "Create UMI Report" Summary table (figure 12.11). When there is no difference in Q score between reads and UMI reads, adjust the Average quality parameter as described above. Note that paired UMI reads are considered two reads when counting UMI reads, hence when inspecting the table in figure 12.11, there are almost twice as many UMI reads as there are UMI groups.
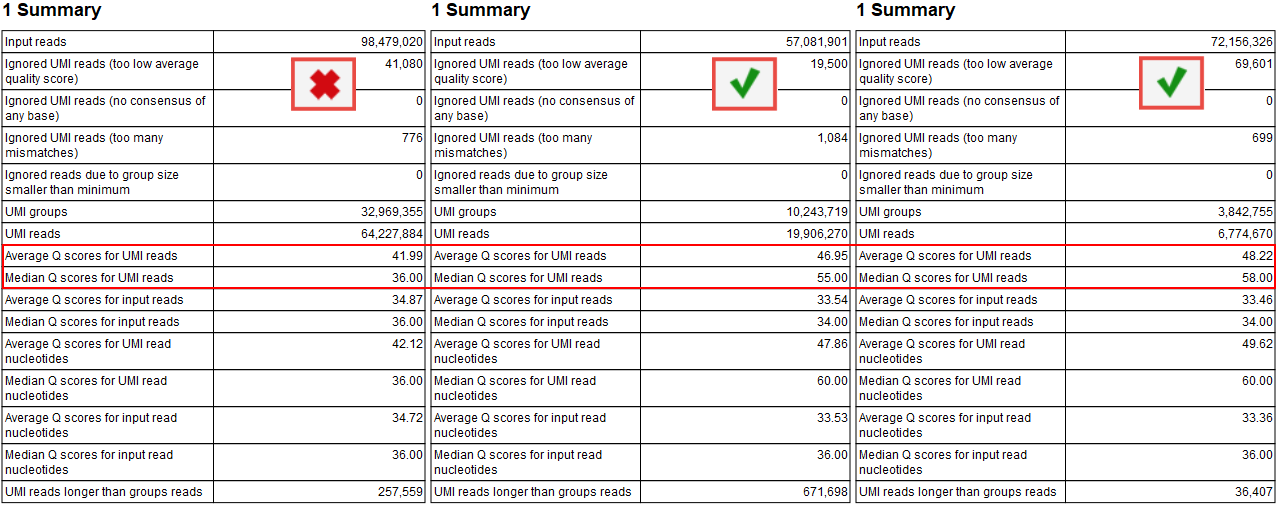
Figure 12.11: Summary section of the Create UMI report highlighting average and median Q scores
Composition of the barcodes used in the library prep.
The base composition of the barcodes used for UMI tagging is not dependent on the user (the barcodes are random) and can also be independent of the quality of the library preparation (input, reads per UMIs etc), but it will affect the quality of the consensus creation.
If the barcodes are not unique (i.e., their base composition is in percentage of the total barcodes very small), there is a risk that the UMI consensus step will group barcodes together that are meant to tag different fragments, and therefore reducing the quality of the consensus. This can be inspected in the plot "Nucleotide percentages of the unique molecular barcode symbols" of the report "Create UMI report" (figure 12.12). For good quality, we expect the distribution to be skewed to the left as much as possible.
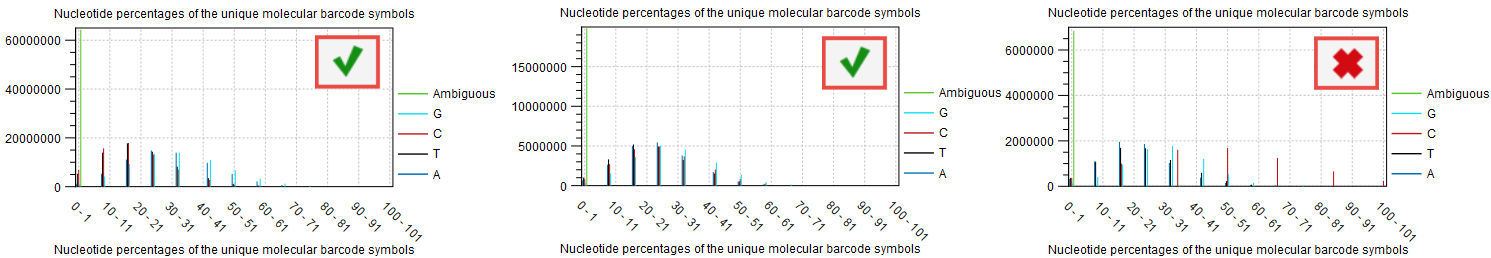
Figure 12.12: Item no. 18 from the Create UMI report showing the nucleotide composition of the barcode.
Coverage and accuracy when using UMIs
Appropriate coverage is important to achieve the best results when using UMIs, particularly when you wish to call variants with an allele-fraction lower than 5%. In our analyses, we observe that a UMI-coverage of at least 2000X is recommended to achieve the best results.
We analyzed only variants with variant allele-fraction (VAF) of 1%, thus measuring the performance of the workflow only on variants considered more difficult to detect. In these scenarios, UMIs are expected to reduce significantly the number of false-positives, and therefore show the highest impact on precision. The plots in figure 12.13 illustrate the relationship between sensitivity and coverage, precision and overage, and accuracy and coverage, with sensitivity, precision and accuracy defined as:
Sensitivity =
![]()
Precision =
![]()
Accuracy calculated at F1 = 2 * ((Precision * Sensitivity) / (Precision + Sensitivity))
and TP: True Positives, FN: False Negatives, FP: False Positives.
A/ For sensitivity, the total number of reads are known to be an important factor, influencing the number of variants called, and hence sensitivity. Comparing our results at 2000X UMI-coverage with the results at the same level of raw coverage, the sensitivity of UMI analysis is 90.13%, while a traditional pipeline achieves 77.28%. However, comparing the results on the same subsampled data, the effect of UMI on low VAF loci is more evident only at higher levels of coverage, because the creation of consensus reads reduces the total number of reads, although increasing their quality. The sensitivity analysis (A) also highlights an important message: when sequencing at very high coverage, hard filters may not be appropriate in all situations, as they tend to over-filter, reducing sensitivity. In these cases, adaptive filters may be necessary.
B/ The precision results show the clear advantage of UMI in reducing common errors, and hence the number of false- positive variants. Our results show that precision in detecting variants is higher for the UMI-aware analysis even at the lower coverage levels: 69.79% for UMI versus 63.77% without UMI. While at higher coverage levels, UMI-aware workflow reaches 95.22% in the present analysis, versus 78.48% of the non-UMI workflow. The results of this analysis on VAF 1% variants show that overall the precision of a UMI-aware workflow is higher than the analysis ignoring UMI information, at all coverage levels, and accuracy shows its best performance at higher levels, where sensitivity is >90%.
C/ In the following figure, we observed an accuracy of 92% for UMI-aware at this coverage, compared to 78.4% achieved by the non-UMI workflow.
The relationship between the number of reads per UMI and the original coverage is not straightforward: if the original molecule has been amplified many times, the resulting, seemingly deep, coverage will not add much information.
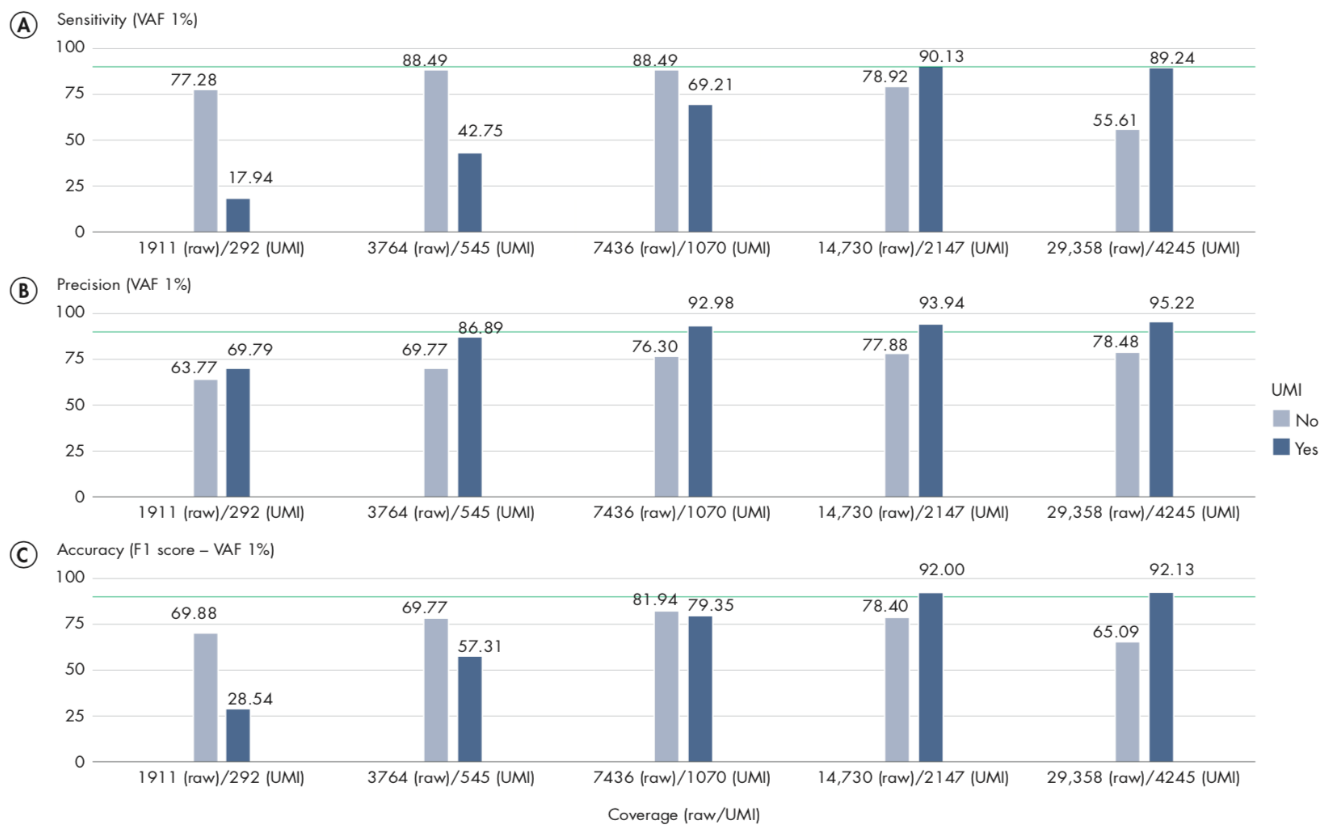
Figure 12.13: Sensitivity, Precision and Accuracy of calling variant allele-fraction of 1% at different raw and UMI coverage values.