Output from the Identify TMB Status workflow
The Identify TMB Status workflow produces a TMB report (![]() ) that contains the TMB score (calculated as the number of mutations per Mb) and TMB confidence values (figure 12.29). The TMB confidence is based on the size of the target regions included in the TMB score calculation, i.e., those with a coverage at least 100X: TMB confidence is low if fewer than 900,000bp of target regions have sufficient coverage, high if more than 1,000,000 bp of target regions have been included in the calculation, and intermediate in between these 2 values.
) that contains the TMB score (calculated as the number of mutations per Mb) and TMB confidence values (figure 12.29). The TMB confidence is based on the size of the target regions included in the TMB score calculation, i.e., those with a coverage at least 100X: TMB confidence is low if fewer than 900,000bp of target regions have sufficient coverage, high if more than 1,000,000 bp of target regions have been included in the calculation, and intermediate in between these 2 values.
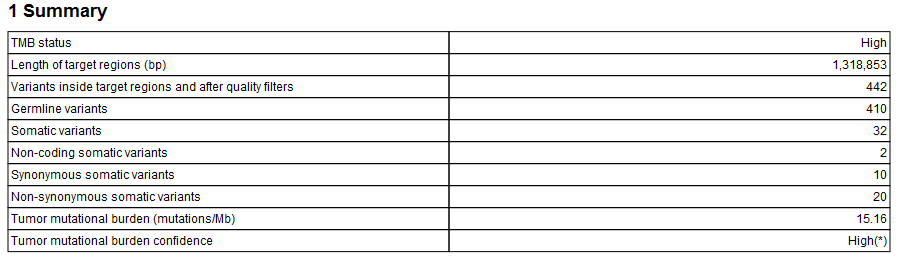
Figure 12.29: An example of a TMB report.
Note that it is possible to configure the Calculate TMB Score tool to include TMB status information in the report (see Calculate TMB Score).
In addition, the report lists the adjusted length of the target regions (after removal of the regions whose coverage was below 100X). To estimate how the removal of region of low coverage impacted the original target regions, see Section 1.5 of the "QC for Targeted Sequencing - Coverage Report" output, which offers statistics on the numbers of targets for which all positions are covered by the "Minimum coverage" threshold set in the QC for targeted sequencing dialog (100 by default).
The quality filters statistics of the TMB report recapitulates how many variants are removed by the various filters applied by the tool, and the frequency distributions of input and somatic variants.
Here are two high TMB score reports based on different samples: the first sample (to the left) is a cell line cancer (pure) and the second (to the right) is from tissue (mixed with normal tissue). It can be seen from the distribution of the variants at the different frequencies that the pure sample contains somatic variants at higher frequency compared to the tissue sample where the low frequency variants contribute to the TMB score instead (figure 12.30).
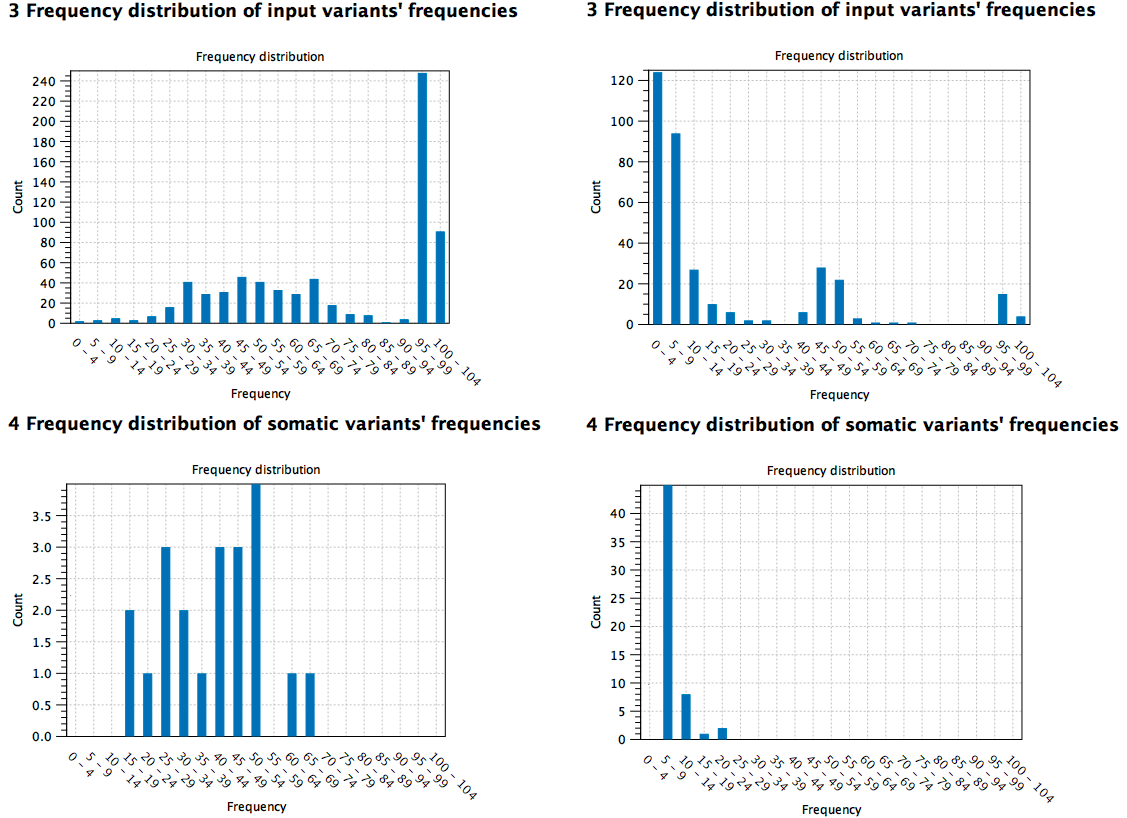
Figure 12.30: Comparison of high TMB score reports based on different samples (pure cell cancer sample to the left versus mixed tissue sample to the right).
The workflow will also generate a Genome Browser View (![]() ) as well as the following files:
) as well as the following files:
- A Trim Reads report (
 ) where you can check that adapters were detected by the automatic detection option.
- A UMI Groups report () containing a breakdown of UMI groups with different numbers of reads, along with percentages of groups and reads (see Calculate Unique Molecular Index Groups).
- A Create UMI report () that indicates how many reads were ignored and the reason why they were not included in a UMI read (see Create UMI Reads from Grouped Reads).
- A Structural Variants report () giving an overview of the different types of structural variants inferred by the Structural Variant analysis.
- A Sample report (
 ) that contains compiled QC metrics from other reports and provides an overview of a given sample. The sample report also reports whether the QC thresholds specified in the Create Sample Report wizard dialog have been met.
- A Read Mapping of the UMI reads (
 ).
).
- A Coverage report () and a Coverage track (
 ) from the QC for Target Sequencing tool (see http://resources.qiagenbioinformatics.com/manuals/clcgenomicsworkbench/current/index.php?manual=QC_Targeted_Sequencing.html).
- Four variant tracks: The Unfiltered variant track (
 ) allows you to review why a variant that was expected in the output would have been filtered out of the Variants passing filters track. The Filtered variant track () includes all variants that remained after the first series of filtering. These filtered variants are input in the Calculate TMB Score tool where they underwent further filtering. The TMB Somatic Variants track () includes variants that remained after the stringent filtering from the tool. These are the variants that were used to calculate the TMB score. The fourth variant track is the Indels indirect evidence track produced by the Structural Variant Caller. This is also available in the Genome Browser View. See http://resources.qiagenbioinformatics.com/manuals/clcgenomicsworkbench/current/index.php?manual=_annotated_variant_table.html for a definition of the variant table content.
- An inversion and a long indels track () containing any inversions and indels longer than 100,000 bp respectively, detected.
- An amino acid track (
 ) that displays a graphical representation of the amino acid changes. The track is based on the CDS track and in addition to the amino acid sequence of the coding sequence, all amino acids that have been affected by variants are shown as individual amino acids below the amino acid track. Changes causing a frameshift are symbolized with two arrow heads, and variants causing premature stop are marked with an asterisk.
- If a read mapping was submitted in the Copy Number Variant Detection dialog, the workflow also ouptputs three CNV tracks () (Target-, Region- and Gene-level) and a CNV Results report ().
The difference between the Unfiltered variant track and the Variants passing filters track depends on the following options available in the filtering steps:
- Filter based on quality criteria: Average Quality (quality of the sequenced bases that carry the variant), QUAL (significance of the variant), Read Position Test Probability (relative location of the variant in the reads that cover the variant position) and Read Direction Test Probability (relative presence of the variant in the reads from different directions that cover the variant position).
- Remove homopolymer error type variants, i.e., errors of the indel type that occur in homopolymer regions. These regions are known to be harder to sequence than non-homopolymeric regions. Note that the definition of homopolymer regions differs between the pipelines due to differences in sequencing technology.
- Remove false positive based on frequency The variant's frequency needs to be above this threshold (2.5% for the TMB application) for the variant to be output by the workflow in the filtered variant track.
The difference between the Variants passing filters track and the TMB Somatic Variant track is that even more stringent filters are applied to exclude variants before calculating the TMB score. For example, only variants with a frequency equal to or higher than 5% will be included in the TMB score. Germline variants, synonymous variants and variants outside of coding regions are also excluded.
The read mapping of the merged UMI groups will let you verify the found variants, and examine why expected variants were not found. The UMI Groups Report gives information about the number of UMI groups found, and how many reads are in each. It includes the following information:
- How many reads were aligned to the reference (Reads in input).
- How many reads were mapped in multiple places and thus discarded.
- Groups merged: How many groups were created by merging singleton groups with other groups.
- Number of groups that were discarded for being too small (by default 0 but the option "Minimum group size" of the Calculate Unique Molecular Index Groups can be set up to discard small groups), and how many reads were thus discarded.
- How many groups were created, and of these how many were singletons groups (groups made with sequences sharing identical UMI).
- How many reads are in the largest group.
- How many different UMIs are in the most divergent group (different sequences with different UMIs can be in the same group, if they start on the same position and if they have UMIs that only differ with one character).
- Statistics about the number of reads in the groups.
- Statistics about groups size and reads not included in these groups (also available as graphs below the table).