Output from Microhaplotype Caller (beta)
The Microhaplotype Caller (beta) output (figure 10.9) is in many ways similar to that of the Low Frequency Variant Detection tool, though a significant difference is that the main annotation level is the high-resolution haplotype alleles. Some annotations are given both on allele variant and haplotype allele level, exemplified by Count and Count', respectively, where the apostrophe indicates the higher detail annotation level.
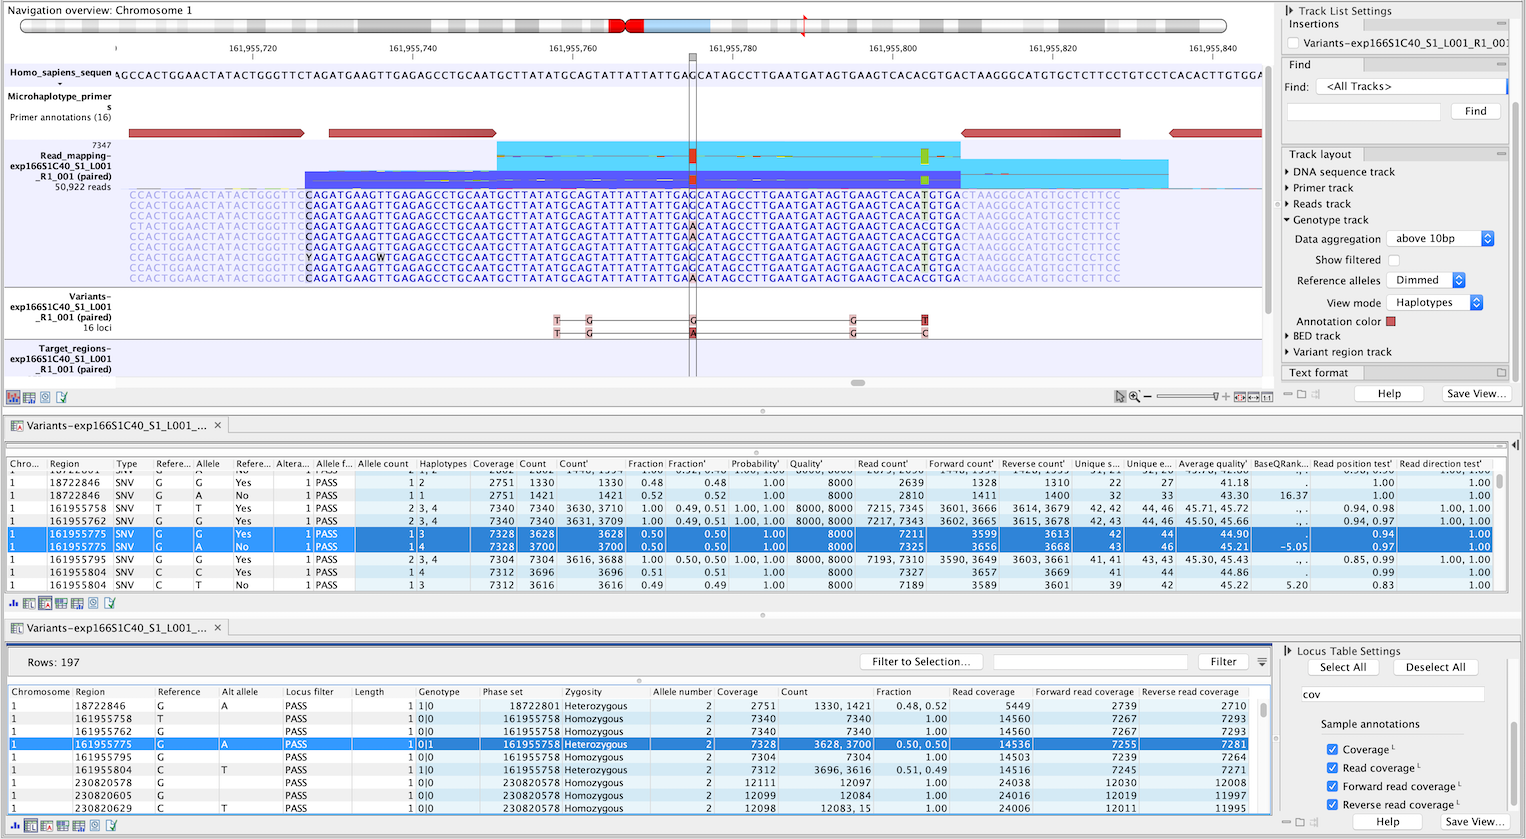
Figure 10.9: Genotype track produced by the Microhaplotype Caller (beta). The figure shows a track list (top) with sequence, primer, reads and Genotype track. The Genotype track was produced by running the Microhaplotype Caller (beta) on the reads track. The Genotype track has been opened in two separate table views (locus and allele) by double-clicking on it in the track list and selecting the desired view in the lower left corner. By selecting a row in the Genotype track table, the track list view is centered on the corresponding locus.
Locus annotations
The following locus annotations are created by the Microhaplotype Caller (beta). Note that general annotations present in all Genotype tracks are described in Genotype track - locus table.
- Coverage
- The fragment coverage at this position. Only countable fragments are considered.
- Read coverage
- The read coverage at this position. Only countable reads are considered.
- Forward
- and Reverse read coverage The countable forward or reverse reads covering this locus.
Allele annotations
The following allele annotations are created by the Microhaplotype Caller (beta). Note that general annotations present in all Genotype tracks are described in Genotype track - allele table.
- Count
- Number of fragments supporting the allele variant, also known as the allele depth. When the allele variant is present in the genotype, counts of haplotype alleles with applied filters are excluded.
- Count'
- Number of fragments supporting the haplotype allele.
- Fraction
- Allele variant fraction at locus, calculated as the number of fragments supporting this variant divided by the total number of fragments supporting all called alleles.
- Fraction'
- Haplotype allele fraction at locus, calculated as the number of fragments supporting this allele divided by the total number of fragments supporting all called alleles.
- Probability'
- The Microhaplotype Caller (beta) makes statistical tests for the various possible explanations for each position. For a given single position variant, the probability is calculated as the sum of probabilities for all the explanations containing that variant. So if a G variant is called, the reported probability is the sum of probabilities for these configurations: G, A/G, C/G, G/T, A/C/G, A/G/T, C/G/T, and A/C/G/T (and also all the configurations containing deletions together with G).
For multi position alleles (e.g. deletions) and haplotypes in general, an estimate is made of the probability of observing the same read data if the allele or haplotype did not exist and all observations were due to sequencing errors (based on the generated sequencing error model). The probability column contains one minus this estimated probability. If this value is less than 50%, the variant might as well just be the result of sequencing errors and it is not reported at all.
- Quality'
- Measure of the significance of an allele, i.e., a quantification of the evidence (read count) supporting the allele, relative to the coverage and what could be expected to be seen by chance, given the error rates in the data.
Quality is calculated as -10log10(1-p), p being the allele probability. Qual is capped at 8000 for p=1, with 8000: highly significant, 0: insignificant. A Quality value of 10 indicates a 1 in 10 chance that the called allele is an error, while a Quality of 100 indicates a 1 in 10^ 10 chance that the called allele is an error.
- Read count'
- The number of reads supporting the allele. Only countable reads are considered. Note that each read in an overlapping pair contribute 1.
- Forward
- and Reverse read count' The number of countable forward or reverse reads supporting the allele.
- Forward/reverse balance'
- The minimum of the forward and the reverse fraction of all reads supporting the allele. Some systematic sequencing errors can be triggered by a certain combination of bases. This means that sequencing one strand may lead to sequencing errors that are not seen when sequencing the other strand. In order to evaluate whether the distribution of forward and reverse reads is approximately random, this value is calculated as the minimum of the number of forward reads divided by the total number of reads and the number of reverse reads divided by the total number of reads supporting the variant. An equal distribution of forward and reverse reads for a given allele would give a value of 0.5.
- Unique starts'
- The number of unique start positions for countable fragments that support the allele. This value can be important to look at in cases with low coverage. If all reads supporting the allele have the same start position, you could suspect that it is a result of an amplification error.
- Unique ends'
- The number of unique end positions for countable fragments that support the allele. This value can be important to look at in cases with low coverage. If all reads supporting the allele have the same end position, you could suspect that it is a result of an amplification error.
- Average quality'
- The average base quality score of the bases supporting a haplotype allele. The average quality score is calculated by adding the Q scores of the nucleotides supporting the haplotype allele, and dividing this sum by the number of nucleotides. In the case of a deletion, the quality score reported is the lowest average quality of the two bases neighboring the deletion. Similarly for insertions, the quality in reads where the insertion is absent is inferred from the lowest average of the two bases on either side of the position.
If there are no values in this column, it is probably because the sequencing data was imported without quality scores.
- BaseQRankSum'
- The BaseQRankSum column contains an evaluation of the quality scores in the reads that have a called allele compared with reference allele quality scores. Reference alleles and variants for which no corresponding reference allele is called do not have a BaseQRankSum value. The score is a z-score derived using the Mann-Whitney U test, so a value of -2.0 indicates that the observed qualities for the allele are two standard deviations below what would be expected if they were drawn from the same distribution as the reference allele qualities. A negative BaseQRankSum indicates an allele with lower quality than the reference, and a positive z-score indicates higher quality than the reference.
- Read position test'
- The test probability for the test of whether the distribution of read positions of this allele in the supporting reads is different from that of all the reads covering the locus.
- Read direction test'
- The test probability for the test of whether the distribution among forward and reverse reads of the allele carrying reads is different from that of all the reads covering the locus.
This value reflects a balanced presence of the allele in forward and reverse reads (1: well-balanced, 0: un-balanced). This p-value is based on a statistic that we assume follows a Chi-square(df=2) distribution under the null hypothesis of the allele having equal frequency on reads from both direction. Note that GATK uses a Fisher's exact test for the same purpose. The difference between both approaches lead to a potential overestimation of p-values output by the variant detection tools of the CLC Workbench.