SNP Tree Variants editor viewer
It is possible to inspect the actual difference in nucleotide counts at a given internal node. This can be done by selecting the internal node of interest (figure 14.12) and then switching from the Show Tree (
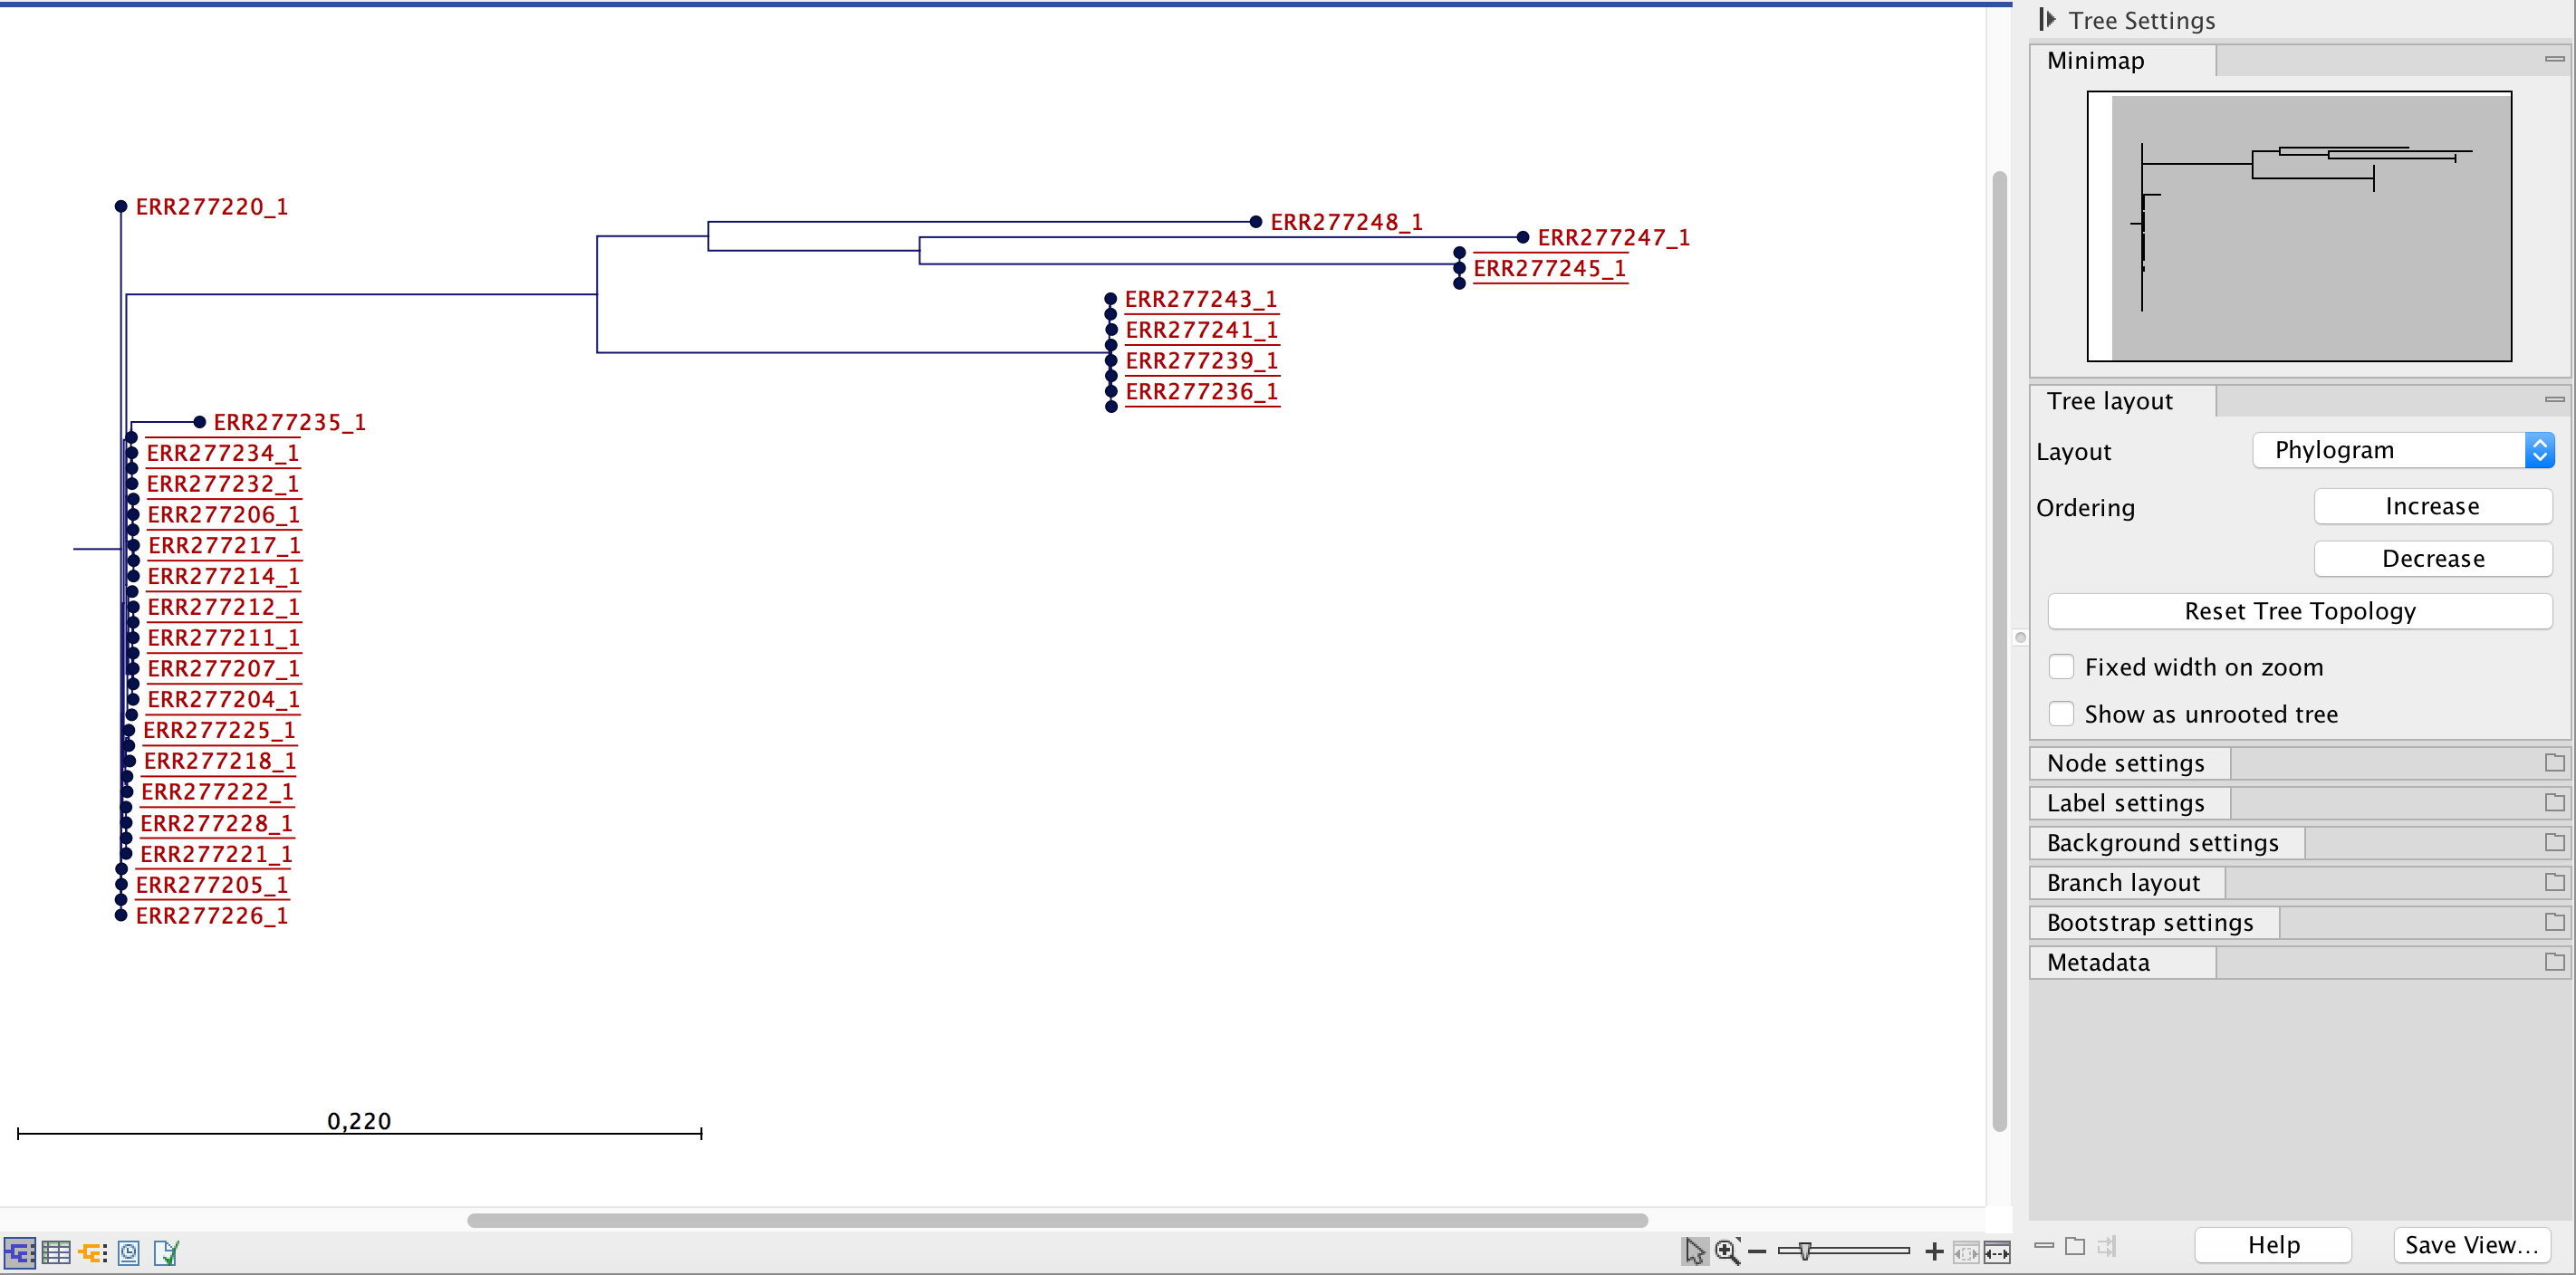
Figure 14.12: Visualization of SNP tree as a phylogram. An internal node is selected for further inspection of the nucleotide differences among the branching samples.
Once in the SNP Tree Variant element view, the table lists the actual SNP input positions used for creation of the SNP tree. The number of rows (in figure 14.13 this is 62,556) corresponds to the number of input positions stated in the filter status table of the SNP Tree report (see figure 14.7). Each row represents a given SNP position, and the distribution of observed nucleotide are counted for each of the subtrees. By filtering on the All agree column it is possible to count the fraction of positions that are identical or different, respectively.
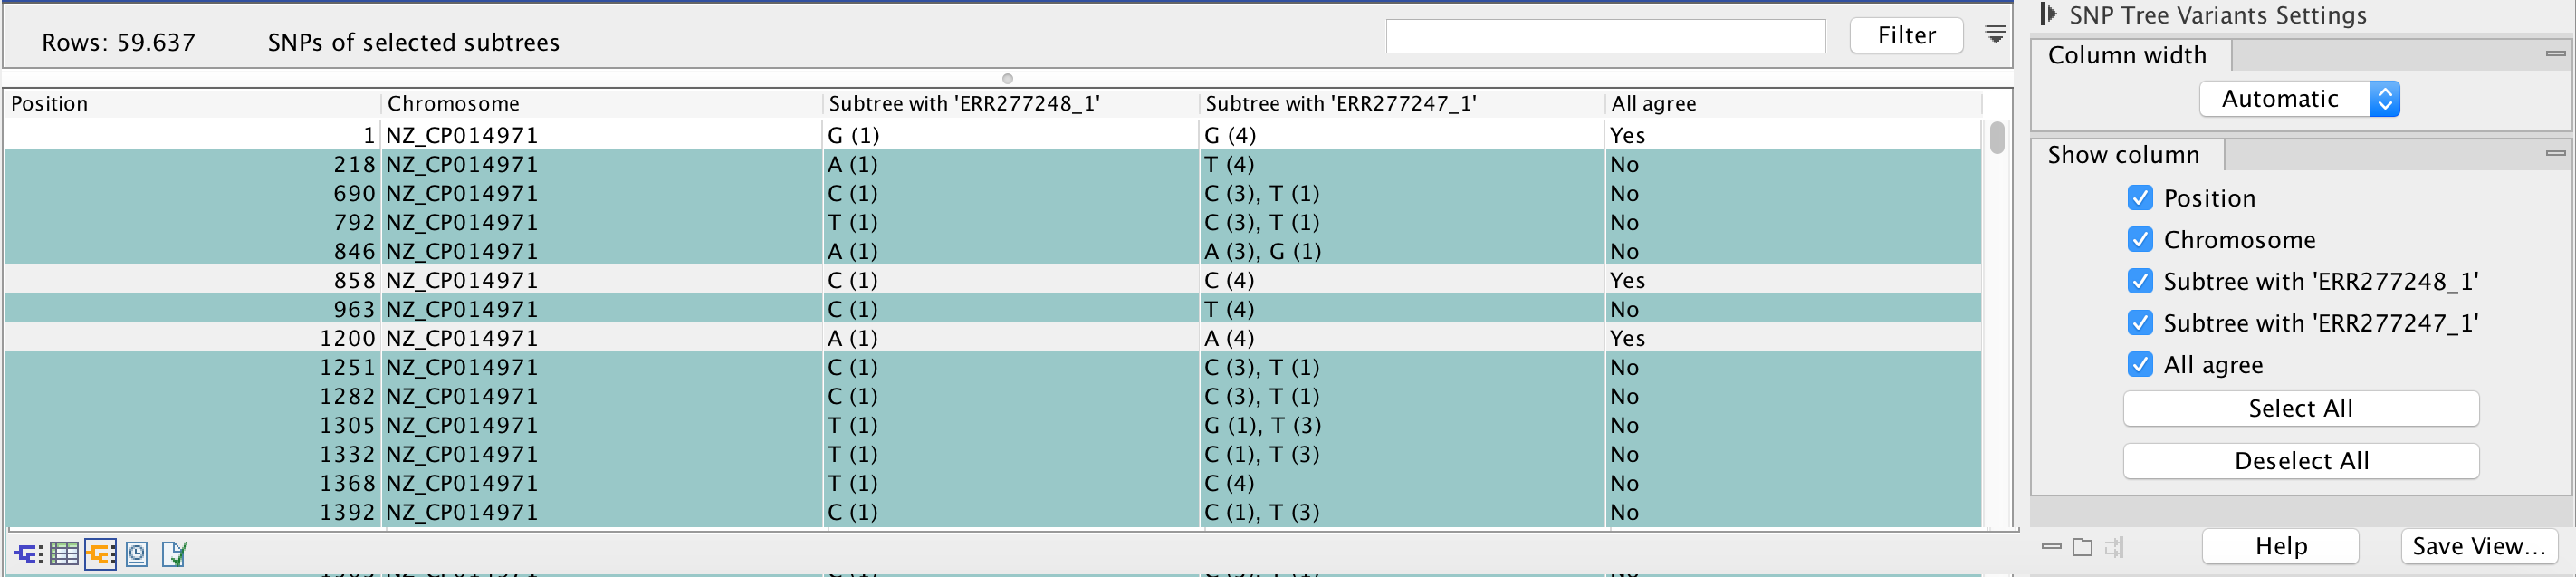
Figure 14.13: Counts of differences at a given position in the branches of the selected internal node.