Create SNP Tree
The Create SNP Tree tool is inspired by Kaas2014. There are two ways to initiate creation of a SNP tree: from the Result Metadata Table (see subsection 11.4) or by running the tool from the Toolbox. Note that you can only create a SNP tree if you have identified a common reference for the different stains you are trying to type, and used it for read mapping and variant calling for each of these samples.
To create a SNP tree from the Toolbox:
Typing and Epidemiology (beta) (![]() ) | Create SNP Tree (
) | Create SNP Tree (![]() )
)
Select the relevant read mappings as shown in figure 14.1
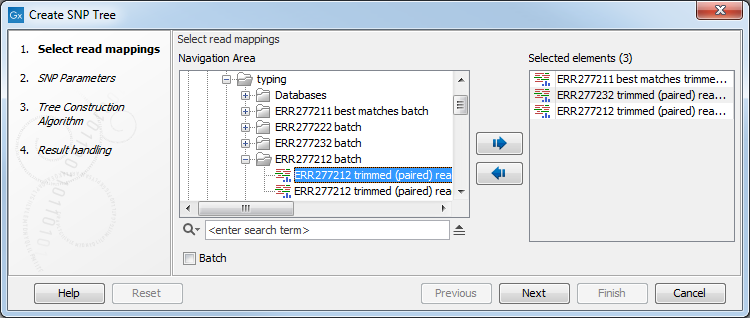
Figure 14.1: Select read mappings to be included in the SNP tree analysis.
Alternatively, select data recursively by right-clicking on the folder name and selecting Add folder contents (recursively) (figure 14.2), but remember to double check that files relevant for the downstream analysis are selected. An efficient alternative to these methods is to use the Quick filtering functionality from the Metadata Result Table to filter easily the data and initiate the SNP tree creation.
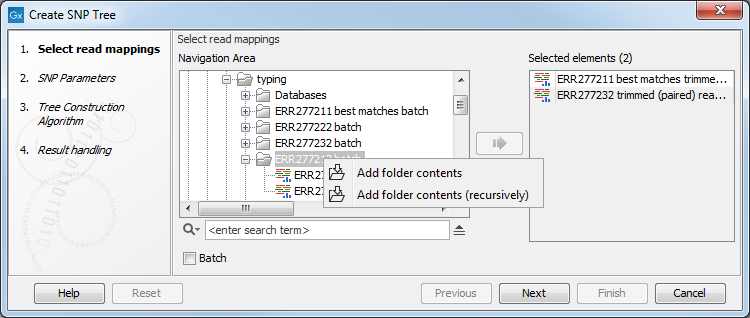
Figure 14.2: For selection of all sequence files in a folder, right click and select Add folder contents (recursively).
Select the variant tracks you want to use (figure 14.3). The variant tracks determine which positions to include in the SNP tree. The variant tracks need to have the same reference as the previously selected read mappings. Under normal circumstances you would select one variant track for each read mapping given in the input step, but that is not a requirement.
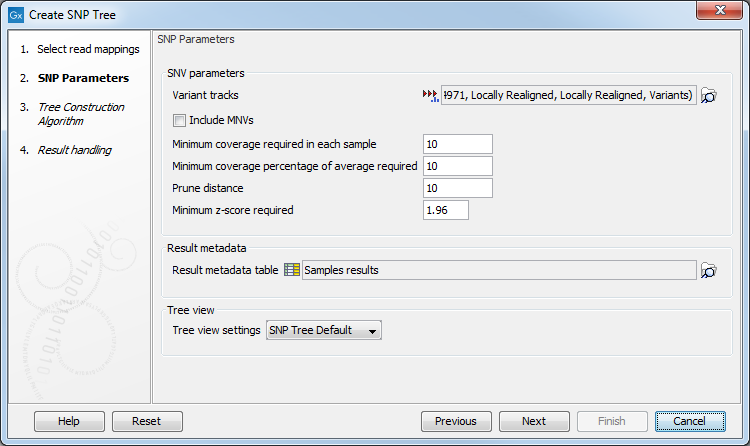
Figure 14.3: Select variant tracks and specify relevant parameters before generation of a SNP tree.
The following Parameters may be specified before setting up the algorithm for the construction of the SNP tree (see figure 14.3):
- SNV parameters
- Variant tracks. Select the variant tracks you want to use. The variant tracks determine which positions to include in the SNP tree.
- Include MNVs or not, along with SNVs when building the SNP tree.
- Minimum coverage required in each sample on a given position. The position is skipped if at least one sample has coverage below the specified threshold.
- Minimum coverage percentage of average required on a given position. The position is skipped if at least one sample has coverage below this percentage of its own average coverage.
- Prune distance specifies the minimum number of nucleotides between unfiltered positions. If a position is within this distance of a previously used position it will be filtered.
- Minimum z-score required. Defining
 as the number of most prevalent nucleotide at a position and
  as the coverage subtracting
  , the z-score is calculated as
 . If the calculated z-score for a given position is less than the specified minimum value the position is filtered.
- Result metadata
- Result metadata Table. Specify location of the Result metadata table file.
- Tree view
- Tree view settings. Select a standard tree setting (i.e., None, K-mer Tree Default or SNP Tree Default) or your own custom tree setting. Read more on Tree Settings in general: http://resources.qiagenbioinformatics.com/manuals/clcgenomicsworkbench/current/index.php?manual=Tree_Settings.html.
The variant calls and read mapping results are used to determine the SNP positions used in the tree. Note that the variant tracks are only used to determine which positions to include in the SNP tree. Only the position and the type (SNP, and MNV if enabled) are used, whereas any information about reference and allele is ignored. The read mappings are then used to estimate the consensus sequence. Only a variant with relative frequency above 50% (haploid organisms) will be effectively considered.
The initial list of variants is reduced as the following: All but one variant from the initial variant lists that fall within the specified pruning distance (for example 10nt) are ignored. Positions that are not well or not covered in one or more read mappings ("Minimum coverage required in each sample" and "Minimum coverage of average required") are removed. In addition, all SNPs which do not have the minimal z-score are excluded.
Select the tree construction algorithm you want to use (figure 14.4).

Figure 14.4: Choose the tree construction algorithm.
When selecting the Neighbor Joining method to create the tree, branch lengths are based on the distance between samples. The distance between two samples is computed as "Number of input positions used where the consensus sequence is different" / "Number of input positions used". The distance is therefore a number between 0 (no difference found in the input positions used) and 1 (all input positions used were different). From the tree, one can compute the distance between two samples by summing up all branches connecting them.
When selecting the Maximum Likelihood method to construct the phylogenetic tree, the next step of the wizard will be to specify the details of the evolutionary model to be used and to specify whether bootstrapping should be performed (see figure 14.5).
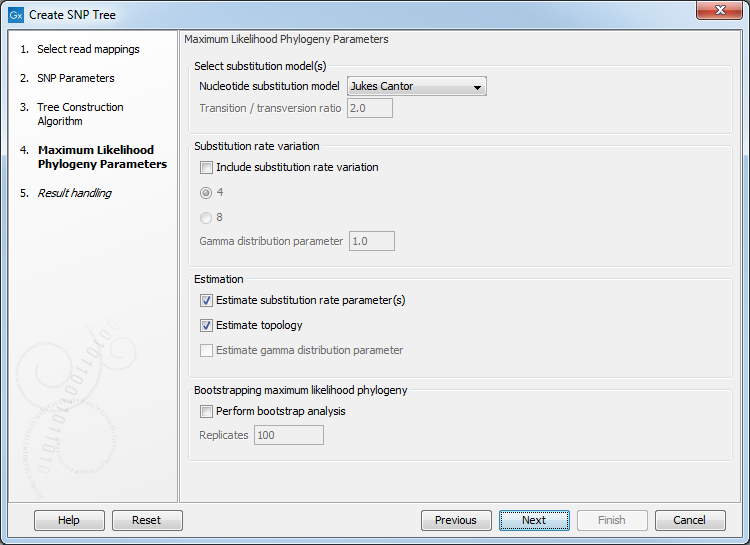
Figure 14.5: Choose the tree construction algorithm.
You can find more information regarding the parameters, see: http://resources.qiagenbioinformatics.com/manuals/clcgenomicsworkbench/current/index.php?manual=Maximum_Likelihood_Phylogeny.html.
The first step of the maximum likelihood algorithm is to produce an alignment of the concatenated SNPs which is to be given as a starting point for the maximum likelihood phylogeny. The Create SNP Tree tool can optionally output this SNP alignment (see figure 14.6).
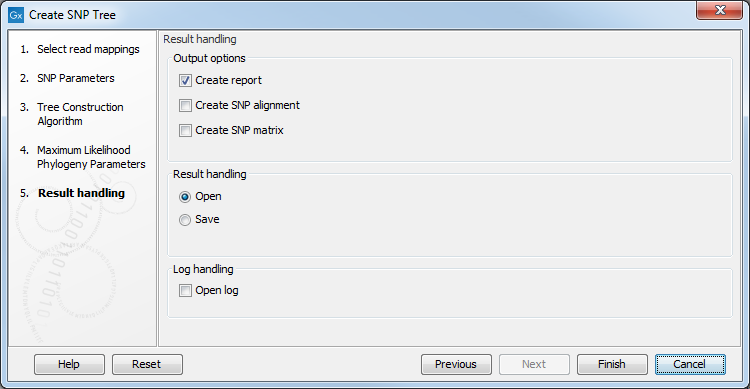
Figure 14.6: Choose the output from the maximum likelihood tree construction.
It may be beneficial to use the SNP alignment as input for the Model Testing tool (described in detail here http://resources.qiagenbioinformatics.com/manuals/clcgenomicsworkbench/current/index.php?manual=Model_Testing.html.
This tool can quantify which evolutionary model best suits the data best. You can then rerun the Create SNP Tree tool with the settings set as suggested by the Model Testing tool.
The maximum likelihood tool starts by creating a starting tree using the Neighbor Joining method. Then it proceeds to calculate the most likely phylogenetic tree under the given evolutionary model.
Subsections
- SNP tree output report
- Visualization of SNP Tree including metadata and analysis result metadata
- SNP Tree Variants editor viewer
- SNP Matrix
