Gene Set Test
Gene Set Test takes a Statistical comparison track (![]() ) and a Gene Ontology Annotation (GOA) table (
) and a Gene Ontology Annotation (GOA) table (![]() ) as input. The tool outputs a GO enrichment analysis table, summarizing the results of hypergeometric tests that evaluate whether terms from the GOA table are over-represented in the set of differentially expressed features from the input track.
) as input. The tool outputs a GO enrichment analysis table, summarizing the results of hypergeometric tests that evaluate whether terms from the GOA table are over-represented in the set of differentially expressed features from the input track.
To run the tool, go to:
Tools | RNA-Seq and Small RNA Analysis (![]() )| Differential Expression (
)| Differential Expression (![]() ) | Gene Set Test (
) | Gene Set Test (![]() )
)
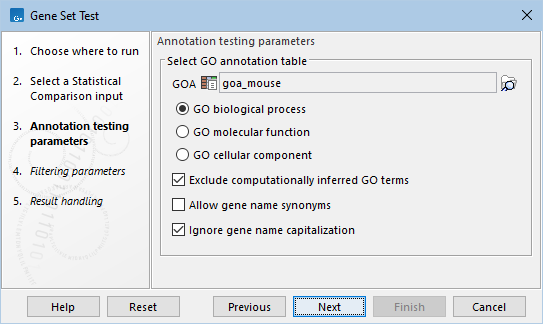
The following options can be configured in the Annotation testing parameters dialog (figure 33.95):
- GOA. A Gene Ontology Annotation (GOA) table (
 ). The values in the "Feature ID" column must match exactly the feature names in the input track.
Several GOA tables are available via the QIAGEN Setstab of the Reference Data Manager. GO annotation files are provided by various sources, including Blast2Go and Gene Ontology, see Generic ontology annotation files. It is also possible to import GOA tables from a tabular file with custom annotations, see Generic annotation file for expression data format.
- Enriched terms within a specific GO aspect are tested. The following are available:
- GO biological process: the larger processes, or 'biological programs' accomplished by multiple molecular activities. Examples: lipid storage, chemical homeostasis.
- GO molecular function: molecular-level activities performed by gene products. Examples: retinoic acid receptor activity, transcription regulator activity.
- GO cellular component: a location, relative to cellular compartments and structures, occupied by a macromolecular machine. Examples: nuclear inner membrane, ubiquitine ligase complex.
- Exclude computationally inferred GO terms. If checked, GO terms with the
[IEA]tag are excluded (figure 33.96). These terms are automatically curated and have not been reviewed by a curator. - Allow gene name synonyms. If checked, matching the "Feature ID" column against the feature names allows synonyms and database identifiers.
- Ignore gene name capitalization. If checked, matching the "Feature ID" column against the feature names is case-insensitive.

Figure 33.95: Annotation testing parameters.

Figure 33.96: GO terms with the [IEA] tag are computationally inferred.
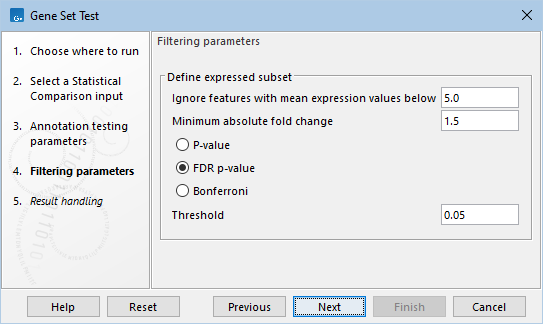
The following options for defining the differentially expressed features can be configured in the Filtering parameters dialog (figure 33.97):
- Ignore features with mean expression values below. Only features with at least this "Max group mean" are kept.
- Minimum absolute fold change. Only features with at least this absolute fold change are kept.
- Threshold. Only features with at most this p-value are kept. The type of the p-value can be set to P-value, FDR p-value, or Bonferroni.

Figure 33.97: Filtering parameters.
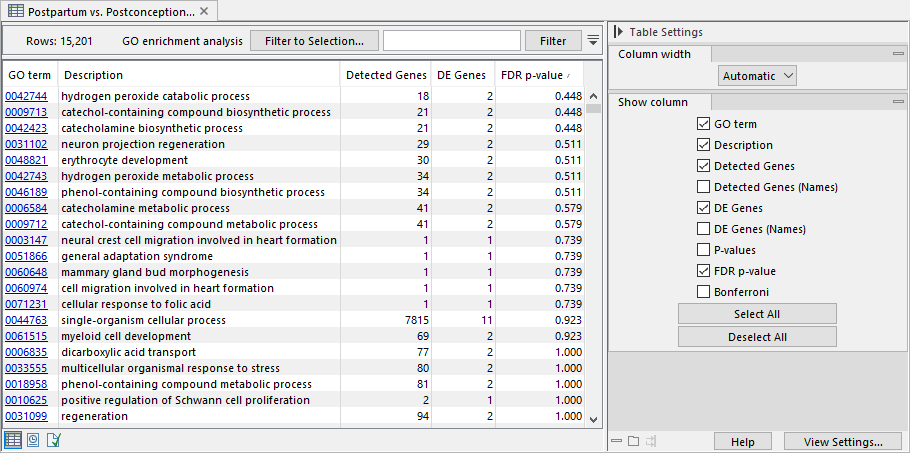
The tool outputs a GO enrichment analysis table (figure 33.98). Each row in the table corresponds to a GO term and includes information on the number and names of the detected and differentially expressed (DE) features, as well as the hypergeometric test p-value, FDR, and Bonferroni corrected p-values.

Figure 33.98: GO enrichment analysis table with rows sorted by FDR p-value.
GO terms are organized in a hierarchical structure. For example, the term "GO:0033151 V(D)J recombination" from the Gene Ontology [Ashburner et al., 2000,The Gene Ontology Consortium, 2019] (https://geneontology.org/) is a descendant of "GO:0006259 DNA metabolic process".
When testing for the significance of a particular GO term, all features linked to descendant GO terms are included in the test. This can lead to a higher number of detected genes in the output table, compared to the number of genes linked to the tested GO term.
Due to the hierarchical structure, GO terms are not independent of one another, and the p-values provided in the enrichment analysis table should be interpreted with caution.
