Viewing the result of k-medoids clustering
The result of the clustering is a Clustering Collection (
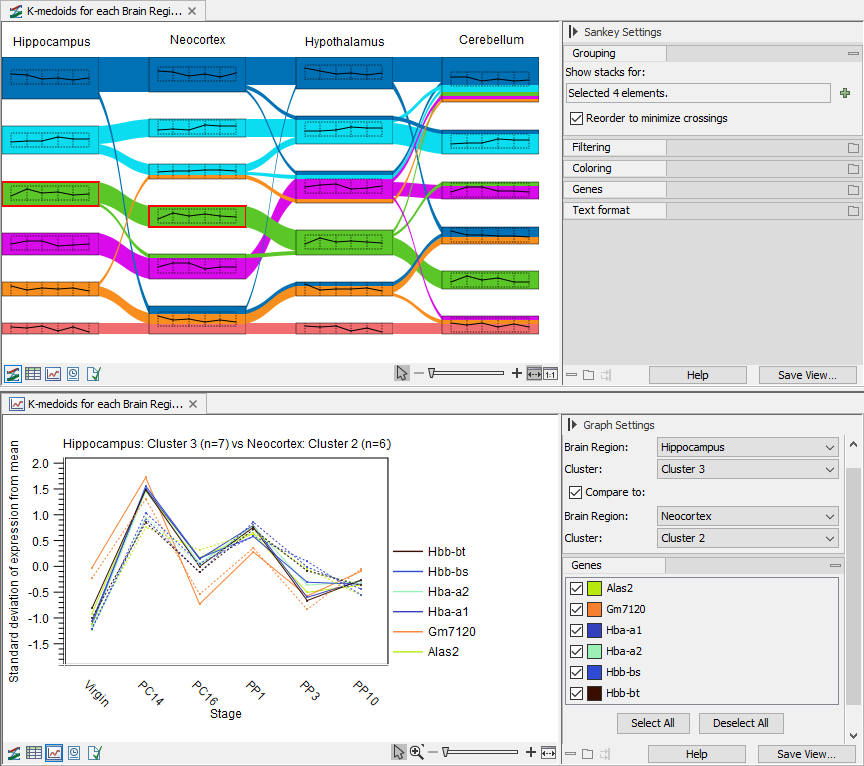
Figure 31.69: Sankey plot example. The data set contains four mouse brain tissues and 6 time points, from virgin to postpartum (GEO accession GSE70732). Top: Features in each brain tissue has been divided into the same number of clusters and the flows indicate how the features change the clusters they belong to in the different tissues. Two clusters are selected, as indicated by the red border. Bottom: The line graph of the clusters to be compared shows the feature expression across the time points for the features found in both selected clusters. Here, cluster 3 in Hippocampus and cluster 2 in Neocortex are compared.
The Sankey plot view is linked to a graph view. Clicking on a thumbnail shows the expression of all the features in the cluster in the linked graph view. Clicking two thumbnails while holding down the Ctrl key (![]() on Mac) shows the features in common to the two selected clusters, see the bottom part of figure 31.66.
on Mac) shows the features in common to the two selected clusters, see the bottom part of figure 31.66.
Thumbnails and flows have a right-click menu which, for example, allows selecting the corresponding features in other views, such as an expression browser, heat map, or the volcano plot of a statistical comparison track.
If you close one of the two views, you can re-open it by holding down the Ctrl key (![]() on Mac) and clicking on the icon for the view you wish to re-open.
on Mac) and clicking on the icon for the view you wish to re-open.
Side panel settings
Adjustments to the Sankey plot and line graph can be done from the side panel.
It is possible to re-order or remove the columns in the Sankey plot, to remove clusters from a column, to select where flows start (defaults to the first column), and to remove all flows except for those originating in specified clusters of the start column. Furthermore, selected features can be highlighted.
- To re-order or remove columns, click the (
 ) button in the side panel in "Show stacks for:" under "Grouping" and use the arrow buttons to order and select columns, see figure 31.67.
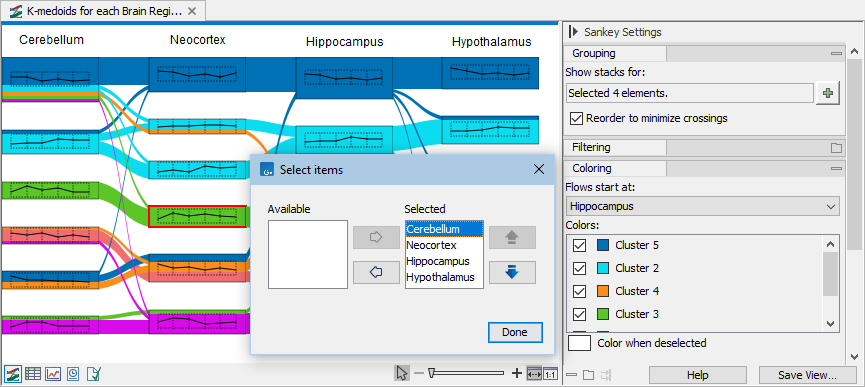
Figure 31.70: Changing the columns order. Note that colors are determined by the column selected in "Flows start at:" in the side panel. - To select where flows start, select the desired column in "Flows start at" in the side panel under "Coloring".
- To remove clusters from a column:
- Click the cluster to select it, right-click and choose "Remove Selected".
- In the side panel, under "Filtering", click the () button for the relevant column, and use the arrow buttons to choose the clusters.
- To remove flows:
- Click a cluster in the first column to select it, right-click and choose "Color only from selected".
- In the side panel, under "Coloring", tick the clusters for which to retain coloring. Flows from the other clusters are colored using "Color when deselected", defaulting to white and making the deselected flows invisible.
Figure 31.68 show an example using filters and colors to highlight features from specific clusters.
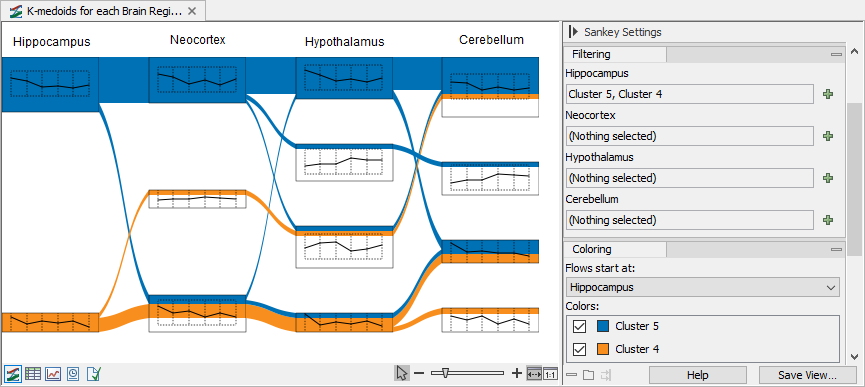
Figure 31.71: Filtering and coloring can help highlighting features flow across clusters. - To highlight features, use the "Select genes to trace in plot" under "Genes" in the side panel. Use space to get the full list of available features. Selected features will be highlighted in the Sankey plot and represented in bold in the line graphs, see figure 31.69
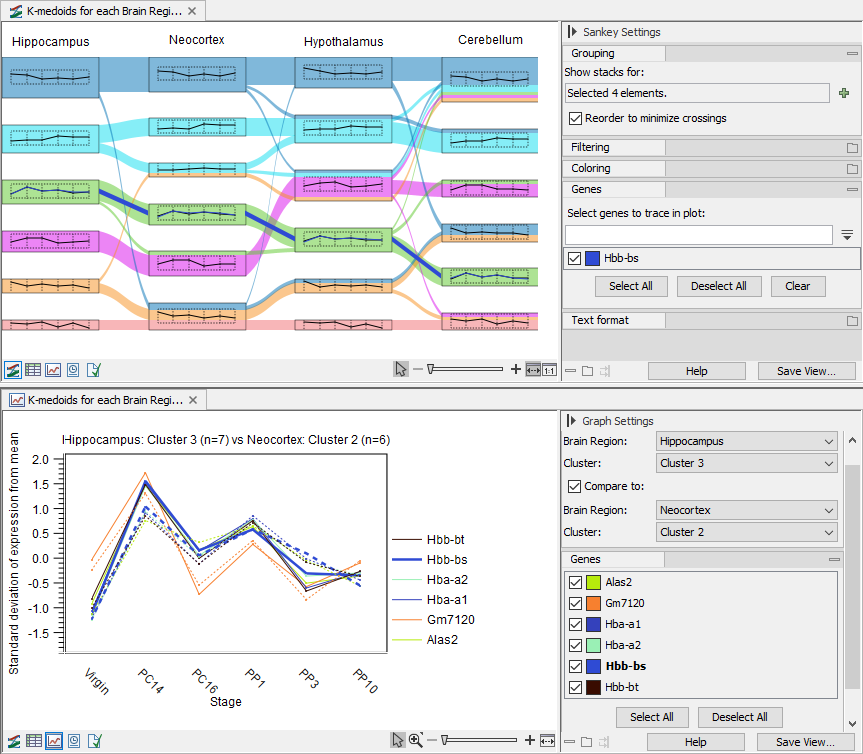
Figure 31.72: Top: The selected feature is highlighted in the plot and its expression is added to the thumbnail. Two clusters are selected. Bottom: The line graph of the clusters to be compared. The selected feature is represented in bold.
The line graph allows two types of adjustments from the side panel, selection of "Cluster" and "Genes". Only features present in the selected clusters are available in the features pick list and they can be added and removed from the line graph using the tick boxes.
Line graph representation
The line representations are dependent on selections:
- One cluster is selected: all lines are solid.
- Two clusters are compared: the expression from the first cluster is represented by solid lines, and the expression from the second cluster is represented by dashed lines.
- Features are selected: the line style (solid or dashed) is as described above for all features. The selected features are highlighted in bold the side panel under "Genes" and their corresponding lines, from both clusters if two clusters are compared, are thicker, see figure 31.69.