Expression browser plot
A plot with bar charts for one or more selected genes/transcripts can be displayed as shown in figure 31.7.
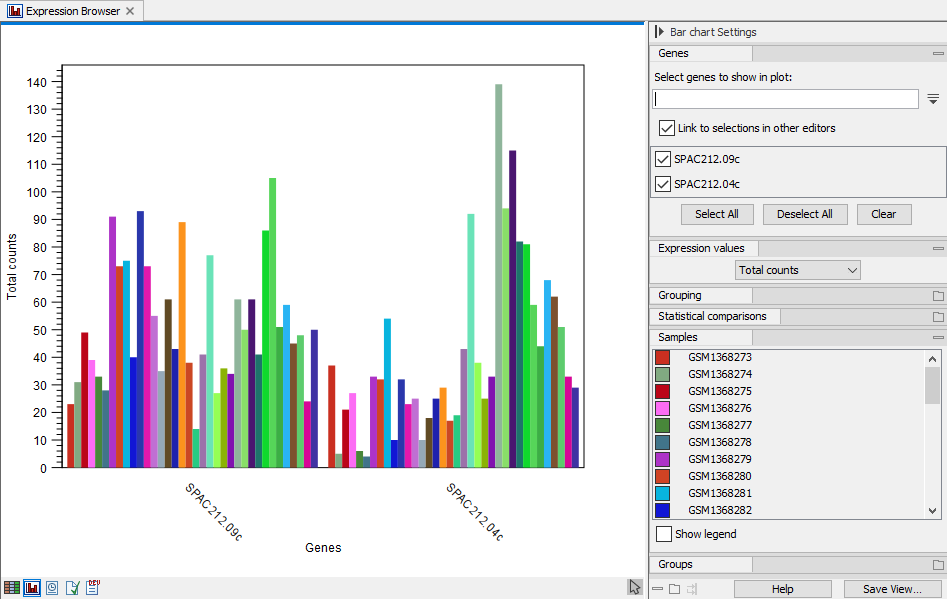
Figure 31.10: Expression browser plot with total counts per sample for two genes
The genes/transcripts can be selected from the search box in the top section of the side panel, titled "Genes" in figure 31.7. Or they can be selected in another editor. A useful setup is a split view of the expression browser with the table in one and the plot in another editor as shown in figure 31.8. The genes selected in the table will be shown in the plot. The automatic selection can be disabled by unchecking "Link to selections in other editors".
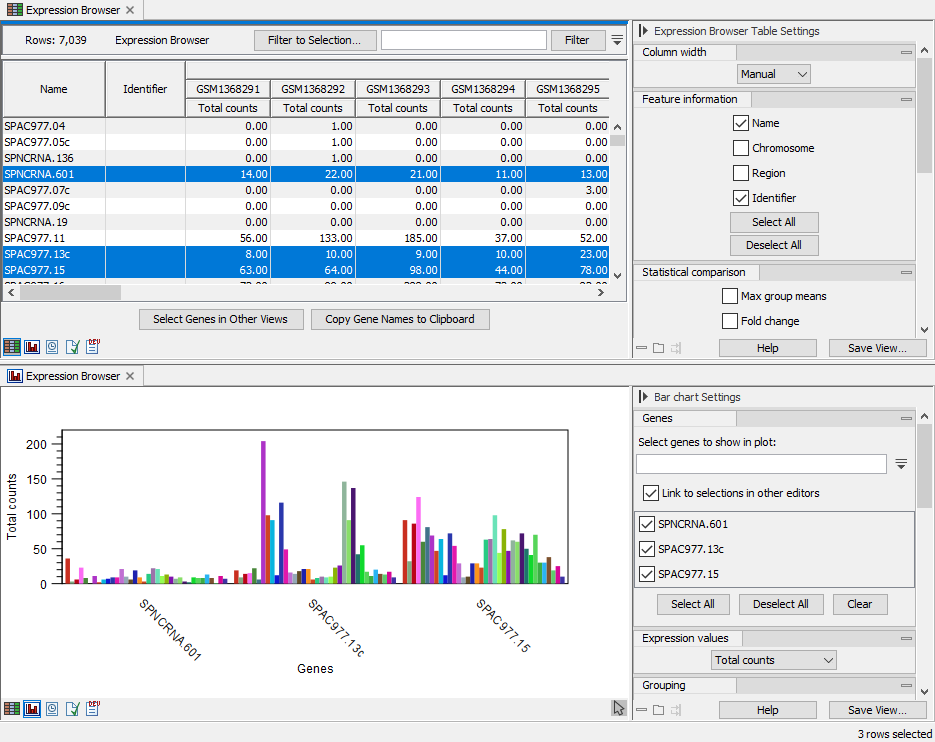
Figure 31.11: Split view of expression browser in table and plot with selections in the table reflected in the plot
The "Expression values" section in the side panel determines what the bars represent: total counts, RPKM, TPM or CPM (TMM-adjusted). See The expression browser for more details on these measurements.
If the samples are associated with metadata, there will be a "Grouping" section in the side panel where it can be selected how to group the samples as shown in figure 31.9. The metadata must be associated prior to the creation of the expression browser.
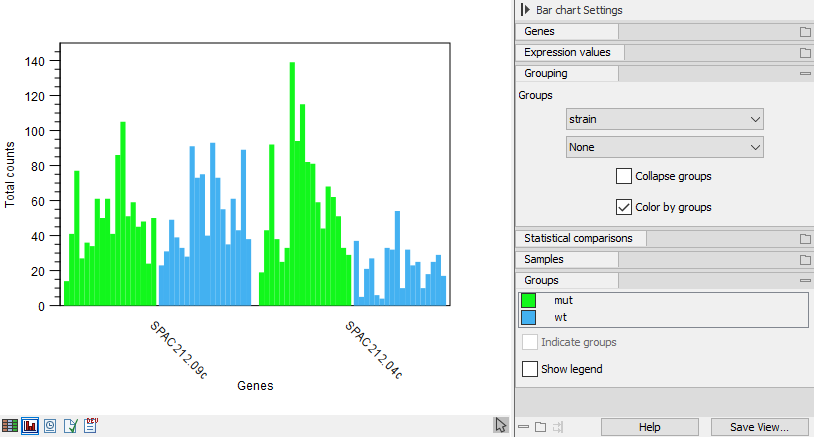
Figure 31.12: Expression browser plot where samples are grouped and colored as defined by metadata
If multiple groups are selected, they will be nested with all possible combinations starting from the top as shown in figure 31.10.
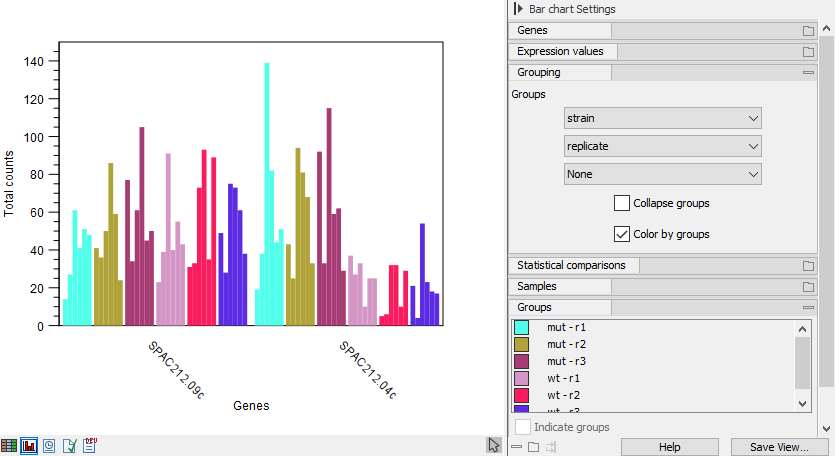
Figure 31.13: Expression browser plot with nested grouping
The bars can also be grouped by metadata whilst being colored by sample as shown in figure 31.11. Or the samples can be collapsed altogether so there is only one bar per group, representing the minimum and maximum values along with an indicator for the average (figure 31.12).
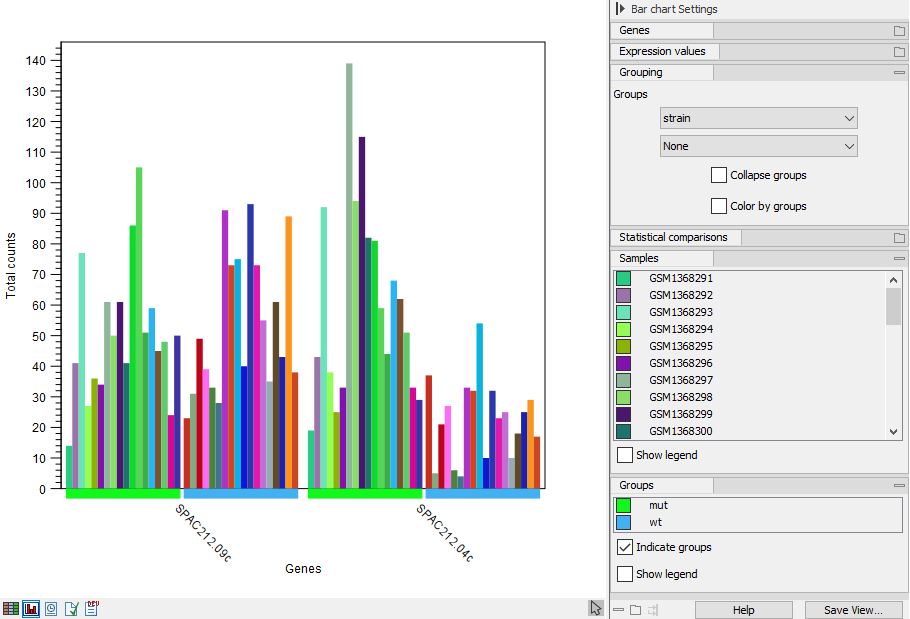
Figure 31.14: Expression browser plot where samples are grouped and colored by metadata
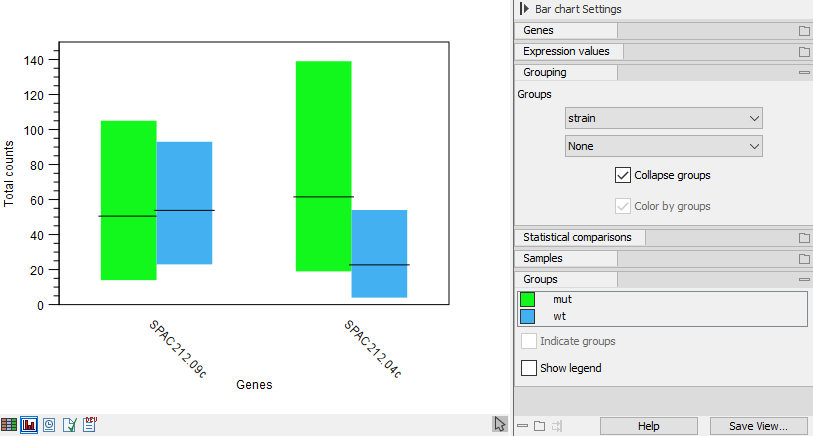
Figure 31.15: Expression browser plot where samples are collapsed to one bar per metadata group
If the expression browser was created with statistical comparisons, there will be a "Statistical comparison" section in the side panel. The statistical comparisons are used to indicate pairs of groups where a gene is differentially expressed subject to a certain threshold. See figure 31.13.
When the first metadata column selected under the "Grouping" section of the side panel matches the factor used when creating one or more statistical comparisons, then these statistical comparisons are applicable and will be listed under the "Statistical comparison" section.
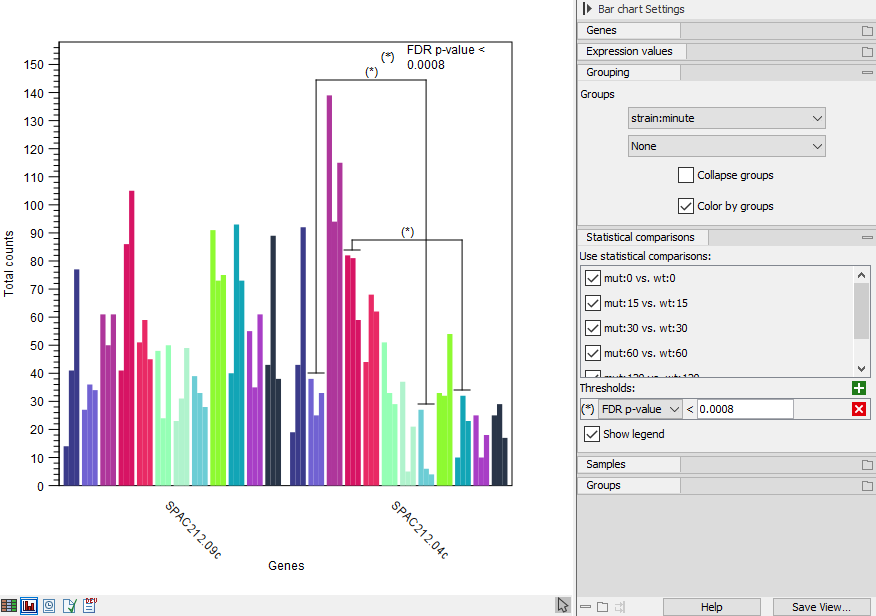
Figure 31.16: Expression browser plot with indication of differentially expressed groups
The thresholds can be defined by plain, FDR or Bonferroni corrected p-value. Multiple thresholds can be input. Pairs of groups are indicated if they satisfy one or more thresholds. An example with multiple thresholds is shown in figure 31.14.
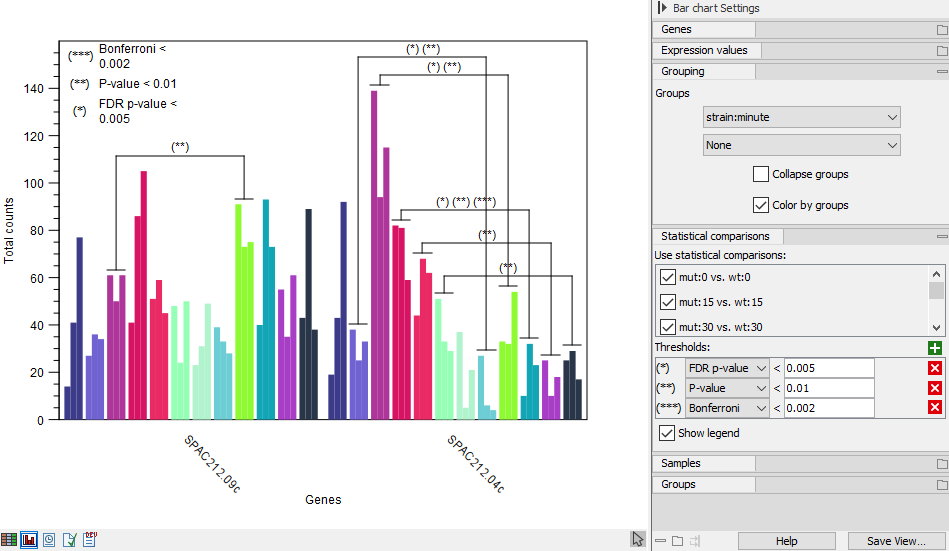
Figure 31.17: Expression browser plot with multiple statistical comparison thresholds
If multiple threshold are defined for the same metric - e.g., FDR p-value below 0.05 and FDR p-value below 0.01 - then a pair of groups has an indication for just the smallest (most specific) threshold.
See Differential Expression for RNA-Seq for more details on statistical comparisons.