Create K-medoids Clustering for RNA-Seq
In a k-medoids clustering, features are clustered into k separate clusters. The procedure seeks to assign features to clusters such that distances between features of the same cluster are small, while distances between clusters are large.
The output of the tool is a Clustering Collection (![]() ). The clusters in the Clustering Collection can be viewed together as a Sankey plot (
). The clusters in the Clustering Collection can be viewed together as a Sankey plot (![]() ) or individually as graphs (
) or individually as graphs (![]() ).
).
To perform a k-medoids clustering:
Toolbox | RNA-Seq and Small RNA Analysis (![]() )| Expression Plots (
)| Expression Plots (![]() ) | Create K-medoids Clustering for RNA-Seq (
) | Create K-medoids Clustering for RNA-Seq (![]() )
)
Select at least two expression tracks (![]() ), or miRNA expression tables (
), or miRNA expression tables (![]() )/ (
)/ (![]() ).
).
Click Next to display a dialog as shown in figure 31.65.
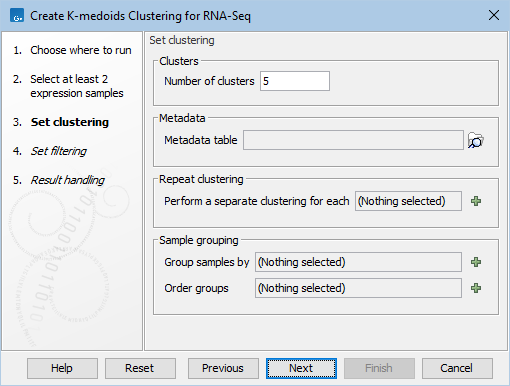
Figure 31.68: Parameters for k-medoids clustering.
The parameters are:
- Number of clusters. The maximum number of clusters to cluster features into: the final number of clusters will be smaller than this if there are fewer features than clusters.
- Metadata table (Optional) The metadata table describing the factors for the selected inputs.
- Perform a separate clustering for each (Optional) one of the factors from the metadata table. A separate k-medoids clustering is performed for each group in this factor. The clusters for each group form separate columns in the Sankey plot. This is useful when looking for genes whose expression pattern changes in a certain way between groups. The groups could, for example, represent different treatments.
- Group samples by (Optional) One of the factors from the metadata table. The distances between samples for a feature are calculated using the group means. If this is left blank, then distances will be calculated using all the individual values of the samples.
- Order groups (Optional) For the chosen Group samples by, specify the order of the groups. The ordering controls the x-axis of the expression graphs. This is useful when the data has a natural ordering, such as a time series. If only some groups are ordered here, then these will come first, and the remaining groups will be added at the end.
There are several different Filter settings to filter features:
- No filtering Keeps all features.
- Keep fixed number of features
- Fixed number of features The given number of features with the highest index of dispersion (the ratio of the variance to the mean) are kept. Raw count values (not normalized) are used for calculating the index of dispersion.
- Minimum counts in at least one sample Only features with more than this number of counts in at least one sample will be taken into account. Raw count values (not normalized) are used.
- Filter by statistics Keeps features that are differentially expressed according to the specified cut-offs.
- Statistical comparison A single statistical comparison track output by the Differential Expression for RNA-Seq tool.
- Minimum absolute fold change Only features with a higher absolute fold change are kept.
- Threshold Only features with a lower p-value are kept. It is possible to select which type of p-value to use.
- Specify features Keeps a set of features, as specified by either a feature track or by plain text.
- Feature track Any genes or transcripts defined in the feature track will be kept.
- Keep these features A plain text list of feature names. Any white-space characters, and ",", and ";" are accepted as separators.
We only recommend using Keep fixed number of features for exploratory analysis. This is because, while the chosen features have the most variable expression among all the samples, the variation may not be of interest: for example, maybe there is a large variability across different time points in a time series, but this is the same in both treatment and control groups.
Subsections