Statistics table for each mapping
By checking "Create table with statistics for each mapping", a table showing detailed statistics for each reference sequence will be generated (figure 27.24).
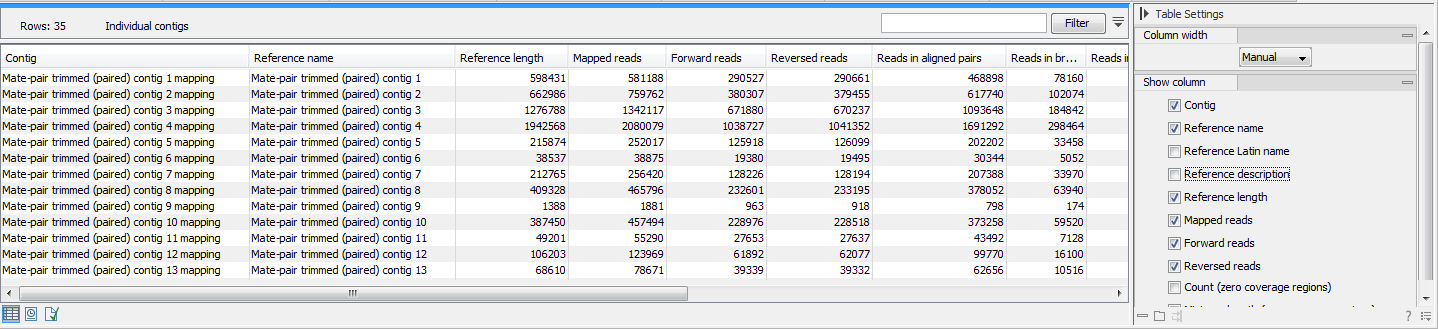
Figure 27.26: Statistics table for a read mapping.
- Contig
- Reference name, Latin name, description, length
- Mapped reads
- Forward and Reverse reads
- Reads in aligned pairs
- Reads in broken pairs: wrong distance or mate inverted, mate on other contig, mate not mapped
- Average distance
- Standard deviation distance. Standard deviation of the mapped pairs distances.
- Non-specific and non-perfect matches
- Minimum, maximum, average coverage
- Standard deviation coverage. Standard deviation of the per base coverage.
- Minimum, average coverage excluding zero coverage regions
- Standard deviation excluding zero coverage regions. Standard deviation of the per base coverage, excluding regions without coverage.
- % GC. GC content of the reference sequence.
- Consensus length
- Fraction of reference covered
- Count (zero coverage regions)
- Minimum, maximum, average and total length (zero coverage regions)
- Standard deviation length (zero coverage regions). Standard deviation of the distribution of the lengths of all the zero coverage regions on that contig.